The plane overhead can locate where you're joining a meeting from
🌐 Languages: 中文 · English
Also posted on X: https://x.com/bojie_li/status/2124169630596137359
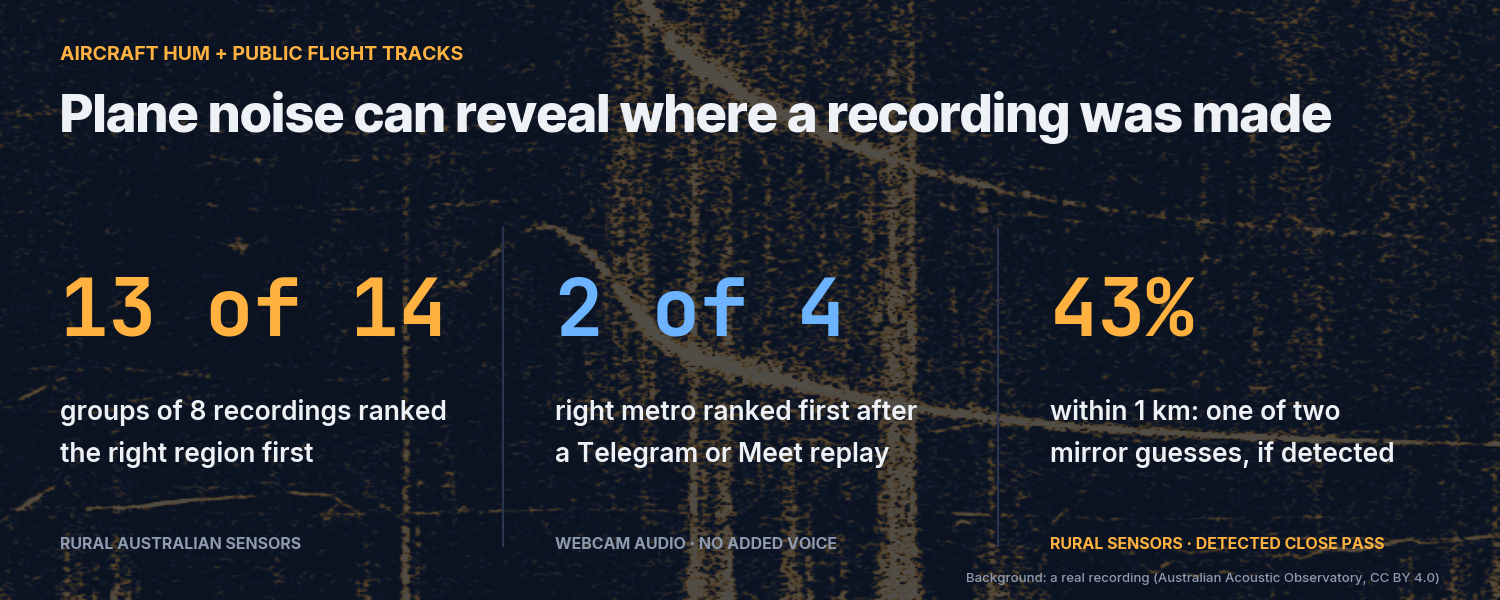 Cover: “Plane noise can reveal where a recording was made” over a real spectrogram of an aircraft's sliding hum (Australian Acoustic Observatory, CC BY 4.0), with three headline results.
When I was in San Carlos and Irvine, I kept hearing small planes overhead. Most of them broadcast their position, and public flight records keep it, timestamped to the second. So I wondered: if a plane flies past while someone is recording audio, can its noise reveal where the audio was recorded?
It can.
- Groups of eight one-hour recordings of one rural Australian place: the right region ranked first for 13 of 14 groups, from 8 sites.
- One detected close pass, local area known: one of two mirror guesses within 1 km for 43% of 75 passes.
- Outdoor webcam audio replayed through Telegram and Google Meet, no added voice: the right metro ranked first for 2 of 4 sites on each app. That’s a tiny sample.
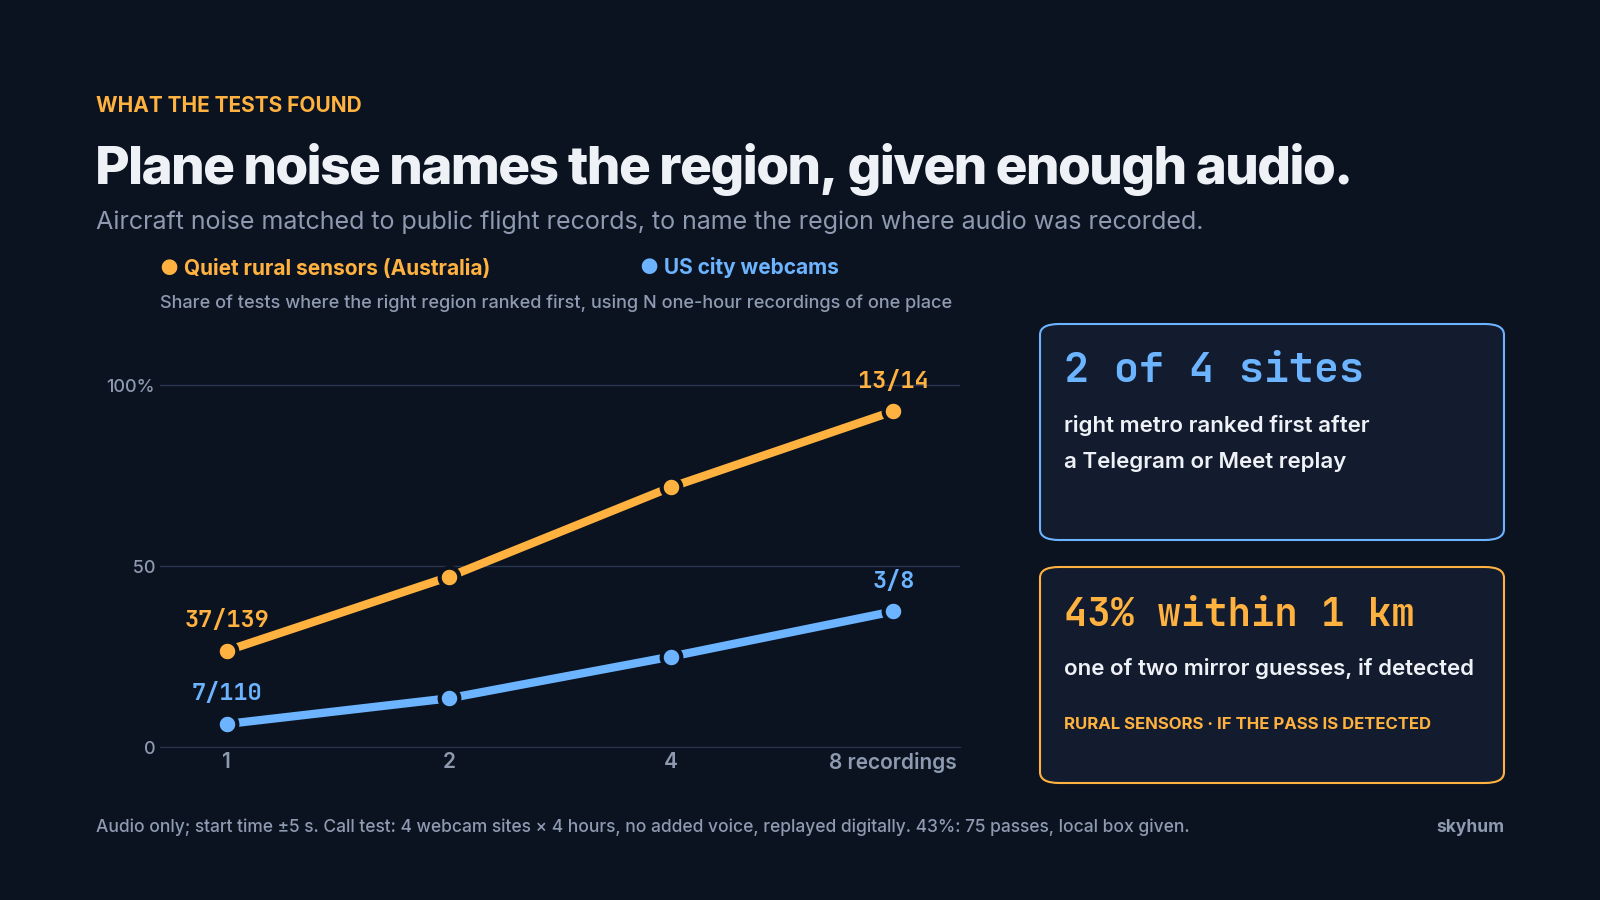 Headline results. Naming the right region from aircraft noise and public flight records, for rural Australian sensors: 37/139 with 1 one-hour recording, rising to 13/14 groups of 8 recordings of one place; US city webcams 7/110 rising to 3/8. Through Telegram and Google Meet with no added voice, the right metro area was ranked first for 2 of 4 sites. One close plane pass, if our loud-event detector catches it: best guess within 1 km for 43% of 75 passes (63% within 2 km), conditional on detection.
The grouped region-ranking replay covered only those four webcam sites. In the two largest series of recordings (rural Australian sensors and US webcams), the right region was ranked first more often when we had several one-hour sessions from the same place.
Open source. The skyhum tool, its trained detector and the code to reproduce these numbers are open source at https://github.com/bojieli/skyhum (alpha), with derived features (no audio) for the public webcam hours in the v0.2.0-alpha release. It is for research and defence, not for locating private individuals. Benchmark metadata is links only, never audio.
Far hum hints at the region; a near pass can narrow it
The two clues differ in scale. A distant hum can narrow the search to a region (a US metro area or county, or an Australian SA4), weakly from one hour. A close pass (an aircraft within about 1.5 km) can place the mic within a kilometre or two, provided our loud-event detector picks it up and the search already has a local area. We measured that only at rural Australian sensors.
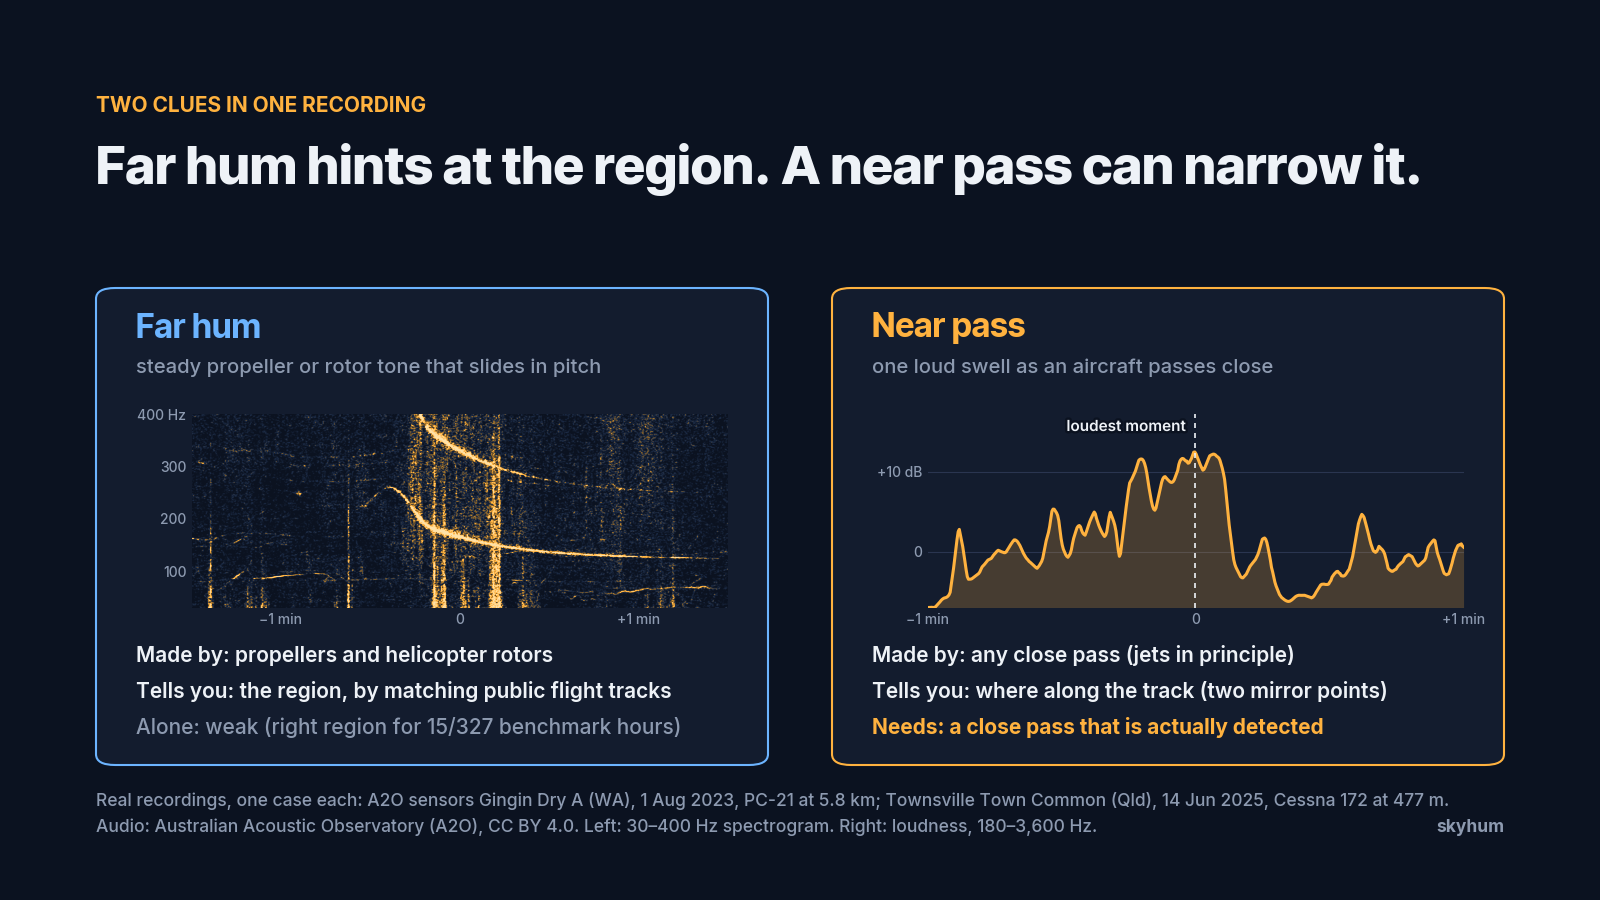 Two real cases. Far hum: a real 30–400 Hz spectrogram of a PC-21 trainer passing 5.8 km from an Australian sensor, its pitch sliding down in an S shape; it helps narrow the region by matching public flight tracks and is weak alone (right region for 15/327 benchmark hours). Near pass: a real loudness curve of a Cessna 172 passing 477 m away, peaking at the loudest moment; it tells you where along the track, as two mirror points, and needs a close pass that is actually detected.
The far hum. Propellers and helicopter rotors produce a steady tone. As with a passing siren, the pitch is a little higher on approach and a little lower as the aircraft leaves. The shape of that slide depends on the aircraft’s speed, how close it came and when it was nearest. Aircraft positions are broadcast and archived publicly. Someone who knows when the recording started, to within about half a minute, can compare the pitch curve with the flights at the time and see which positions on the ground would fit. The far-hum method is colsto’s, from the video I discovered a sound that leaks your exact location (2 November 2026). colsto didn’t release code. The independent open-source implementation we started from, AlanBacker/audio-flyover-geolocation, covers only the far hum and was tested only on synthetic audio. On real recordings it wasn’t accurate. On 8 real cases, with the same local box and a blind clock window, it gave no answer on one, hadn’t finished on another, and its six answers were 3.6 to 45.9 km off. We trained a detector, built a real-recording benchmark and rewrote the search. On the same 8 cases our final version was within 1 km for 7.
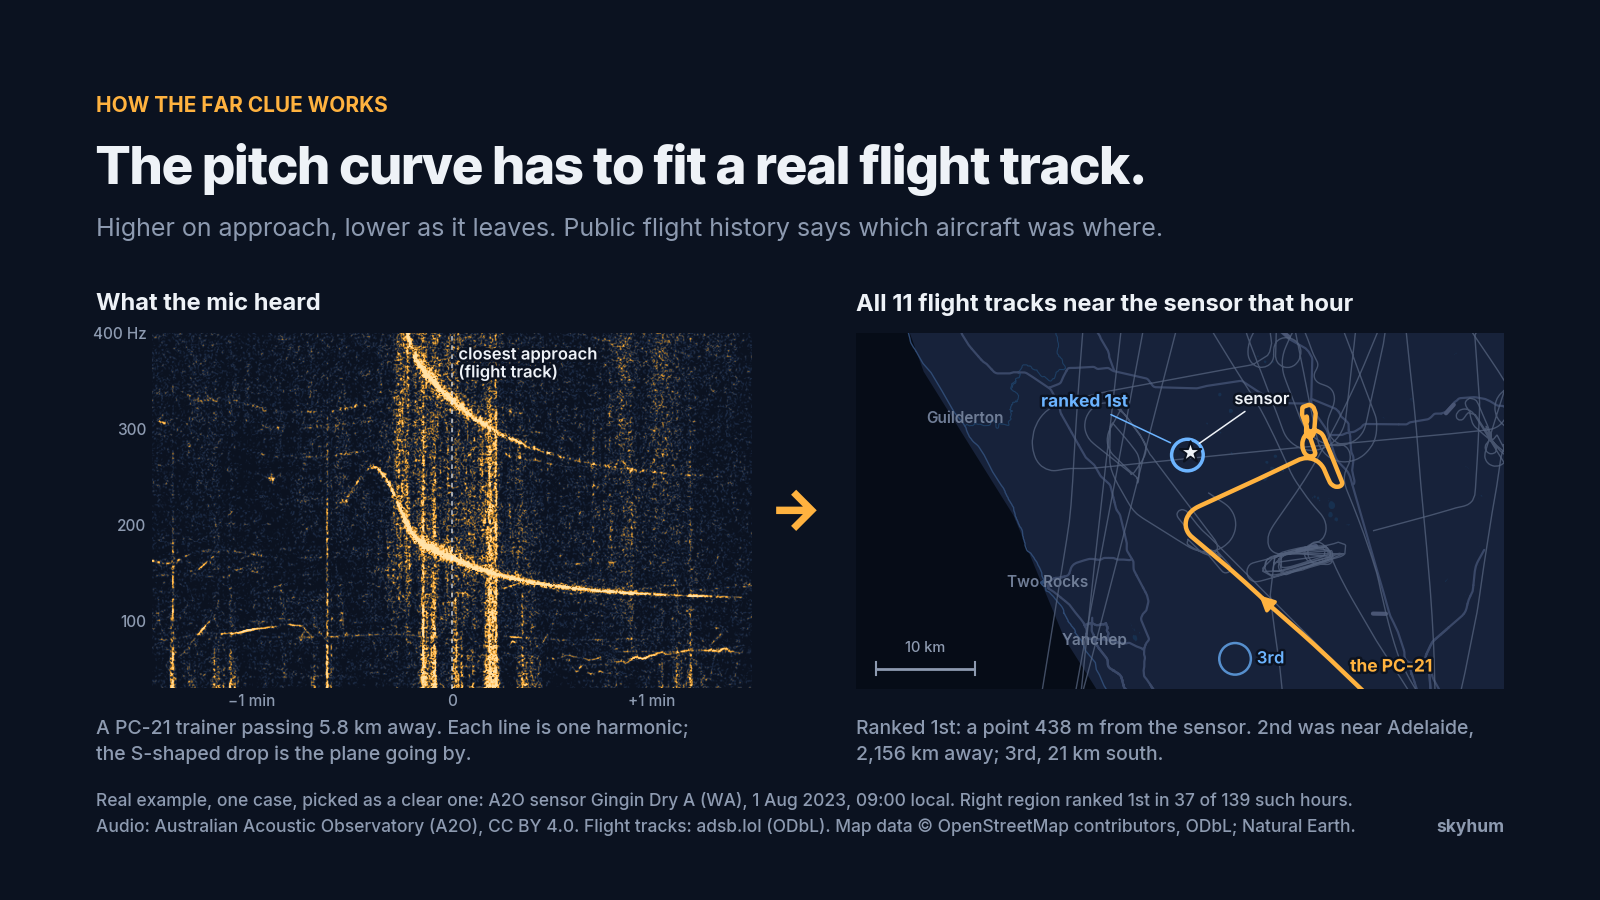 How the far clue works, on real data. Left: a spectrogram from one hour at an Australian sensor (Gingin, WA, 1 August 2023) with the S-shaped drop of a PC-21 trainer passing 5.8 km away. Right: the 11 real flight tracks near the sensor that hour on a map, the PC-21 highlighted. The right region ranked first, with a point 438 m from the sensor; the second-ranked place was near Adelaide, 2,156 km away.
One aircraft rarely settles it. Several, over an hour or across several sessions, narrow the answer to a region.
The near pass. A close pass can make a broadband swell (jets included in principle; our localisation tests were mainly propeller passes). The loudest moment comes close to the aircraft’s closest approach. Its position on the flight track at that second gives the mic’s position along the track. Sound alone can’t distinguish the left side of the track from the right, which leaves two possible places for the mic, one the mirror image of the other. It pins the spot more tightly along the track than one hum curve does, but it is much harder to get, for reasons the near-pass section covers.
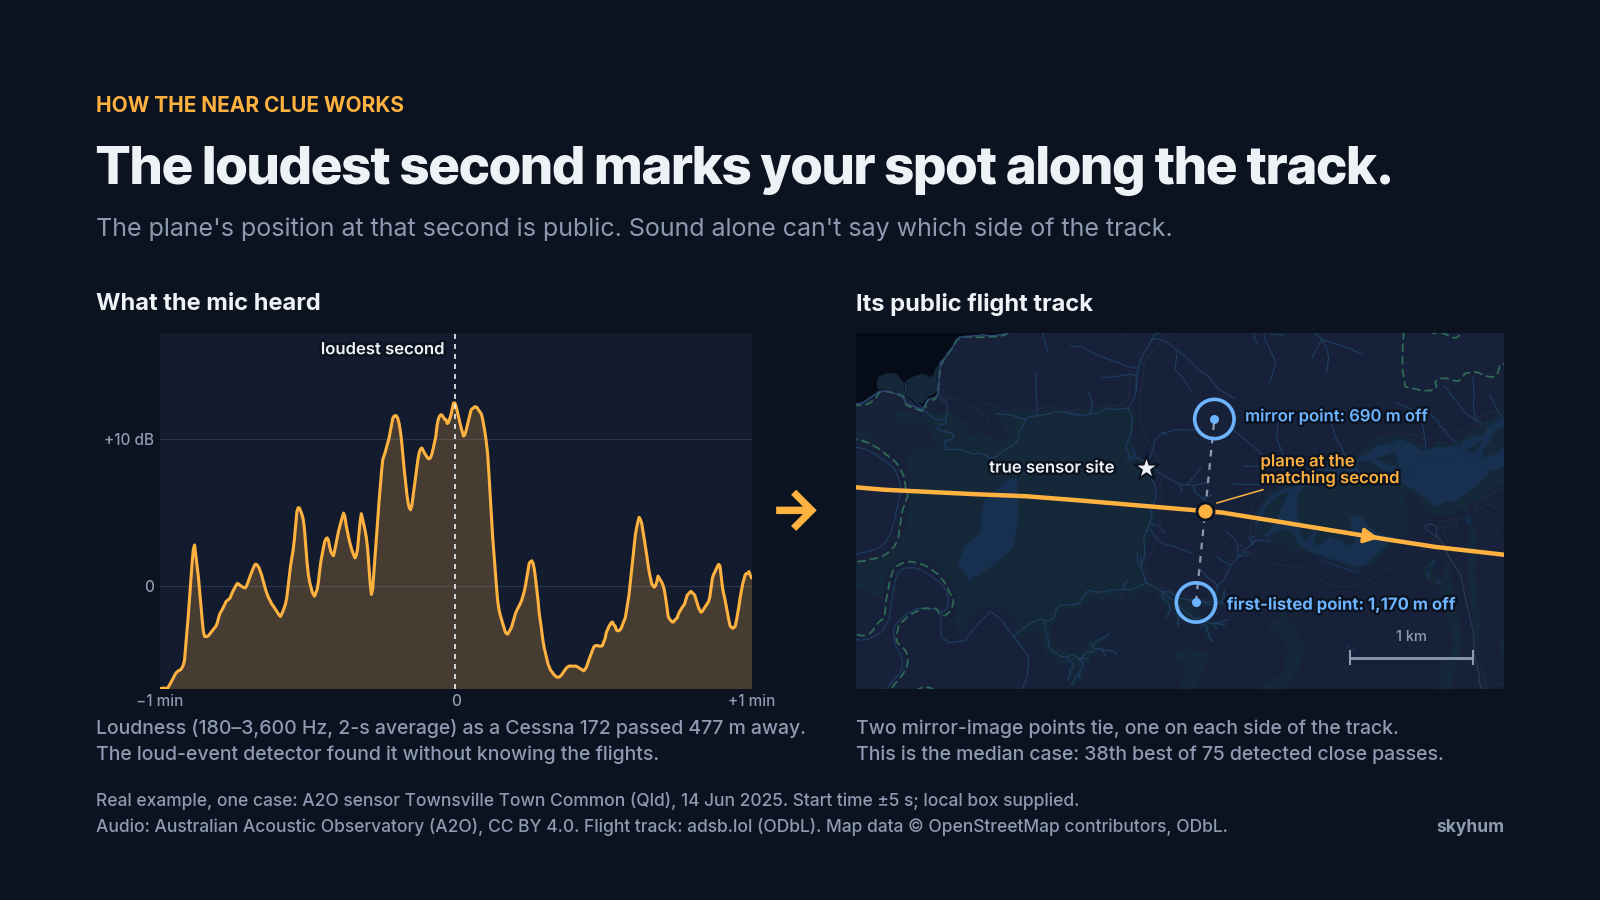 How the near clue works, on real data. Left: loudness of a Cessna 172 passing 477 m from an Australian sensor (Townsville, Queensland, 14 June 2025), peaking at the loudest second. Right: its public flight track on a map with the plane's position at that second, the true sensor site, and the two mirror-image points the locator scored equally, 690 m and 1,170 m from the site. This is the median of 75 detected close passes.
What survives a replay through the apps
The four-site test. We took four hours of sound from each of four outdoor public webcam streams and replayed it digitally through Telegram Desktop and Google Meet (in Chrome) with no added voice. The start time was known to within five seconds, and the search was told which four hours shared a site.
The pass-by-pass test. We used 19 known aircraft passes from rural Australian sensor recordings (a different sample from the four webcam sites above). We labelled them in advance, fed the audio digitally into desktop clients (Telegram Desktop, Zoom, and Meet in Chrome) and checked the output for the same passes with an automated test. The “original clip” row in the figure is the control: the same passes before they were sent to an app. With no added voice it’s 19 of 19 by construction, because we chose clips with passes our test could recognise.
With no added voice, our automated test recognised 17 of 19 passes on Telegram and 13 of 19 on Meet. When we added a talker (a recorded read-speech track, active 60% of the time, 30 dB above the background), the test recognised only 2 of 19 even in the original clip, before it was sent to any app. After transmission it found 0 of 19 on either app.
Zoom’s default noise removal kept 0 of 19 passes and a visible swell in 0 of 7 loud close excerpts. In “Original sound” mode, intended for musicians, the figures were 17 of 19 and all 7 loud excerpts. Loud close excerpts also fared well elsewhere: with no talker, all 12 of ours (9 jets, 3 props, level-normalised) were still visible through both Telegram and Meet.
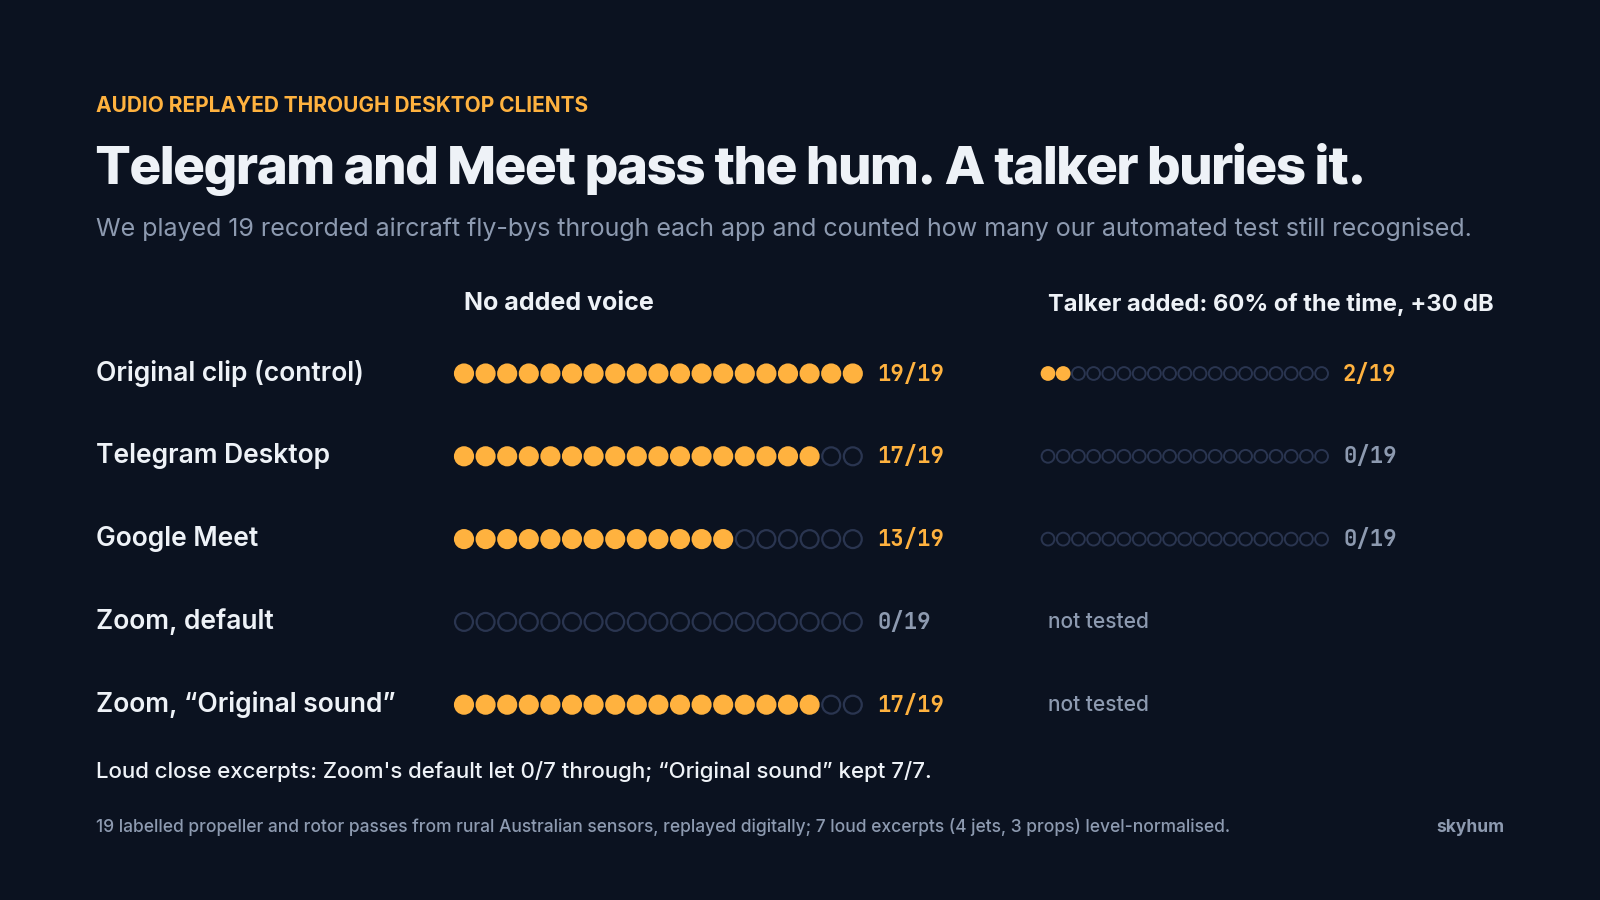 Known aircraft passes recognised by our automated test, out of 19. No added voice: original clip 19/19, Telegram Desktop 17/19, Google Meet 13/19, Zoom default 0/19, Zoom Original sound 17/19. Talker added, speaking 60% of the time at +30 dB: original clip 2/19, Telegram 0/19, Meet 0/19; Zoom not tested with a talker. Loud close excerpts: Zoom default 0/7, Original sound 7/7.
In these outdoor replays on Telegram and Meet, the passes were recognised only without added voice: 17 of 19 on Telegram and 13 of 19 on Meet, against 0 of 19 on each with the added talker.
One hour of hum lost to guessing New York; more hours helped
We searched the contiguous US for the source of each of 327 one-hour recordings in our US benchmark (webcams, event streams and outdoor speech; 36 of them are Canadian event hours, which no method could get right and which count as misses). We knew the start time to within five seconds. The hum put the right region first 15 times (5%). Answering “New York” every time got 50 (15%). The biggest metro in the recording’s time zone was right in 87 of 327 cases (27%). That guess had the benefit of the time zone, which the sound-only search didn’t have. Keeping the time-zone guess unless the sound beat every decoy brought the count to 89.
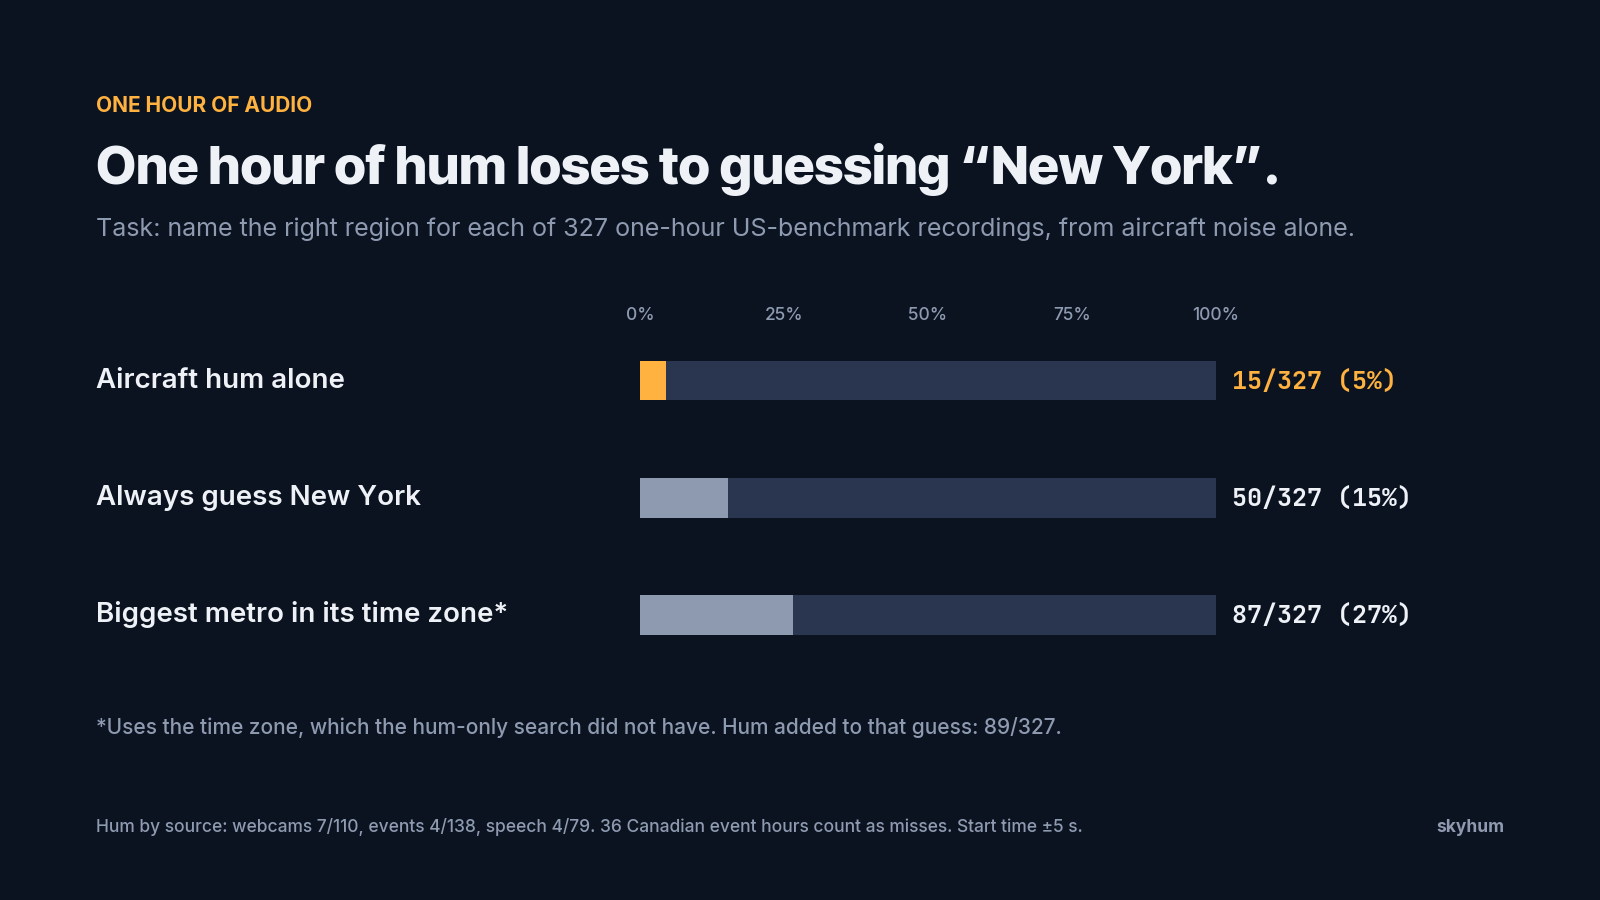 Right region ranked first in 327 one-hour recordings in the US benchmark (36 Canadian event hours count as misses). Aircraft hum alone 15/327 (5%). Always guessing New York 50/327 (15%). Biggest metro in the recording's time zone 87/327 (27%), which uses the time zone; hum added to that guess 89/327. Hum by source: webcams 7/110, events 4/138, speech 4/79.
On the rural Australian sensors, where recordings were quiet, the hum put the right region first for 37 of 139 hours (27%). A guess based on population scored 0 there.
For repeated sessions, we told the search which recordings came from the same spot and kept the location hidden. Each group of recordings counted as one answer.
- For the Australian sensors, the right region came first in 37/139 single hours, 32/68 pairs, 23/32 groups of four and 13/14 groups of eight (8 sites).
- For the US webcams, the counts in the same order were 7/110, 7/52, 6/24 and 3/8 (7 sites).
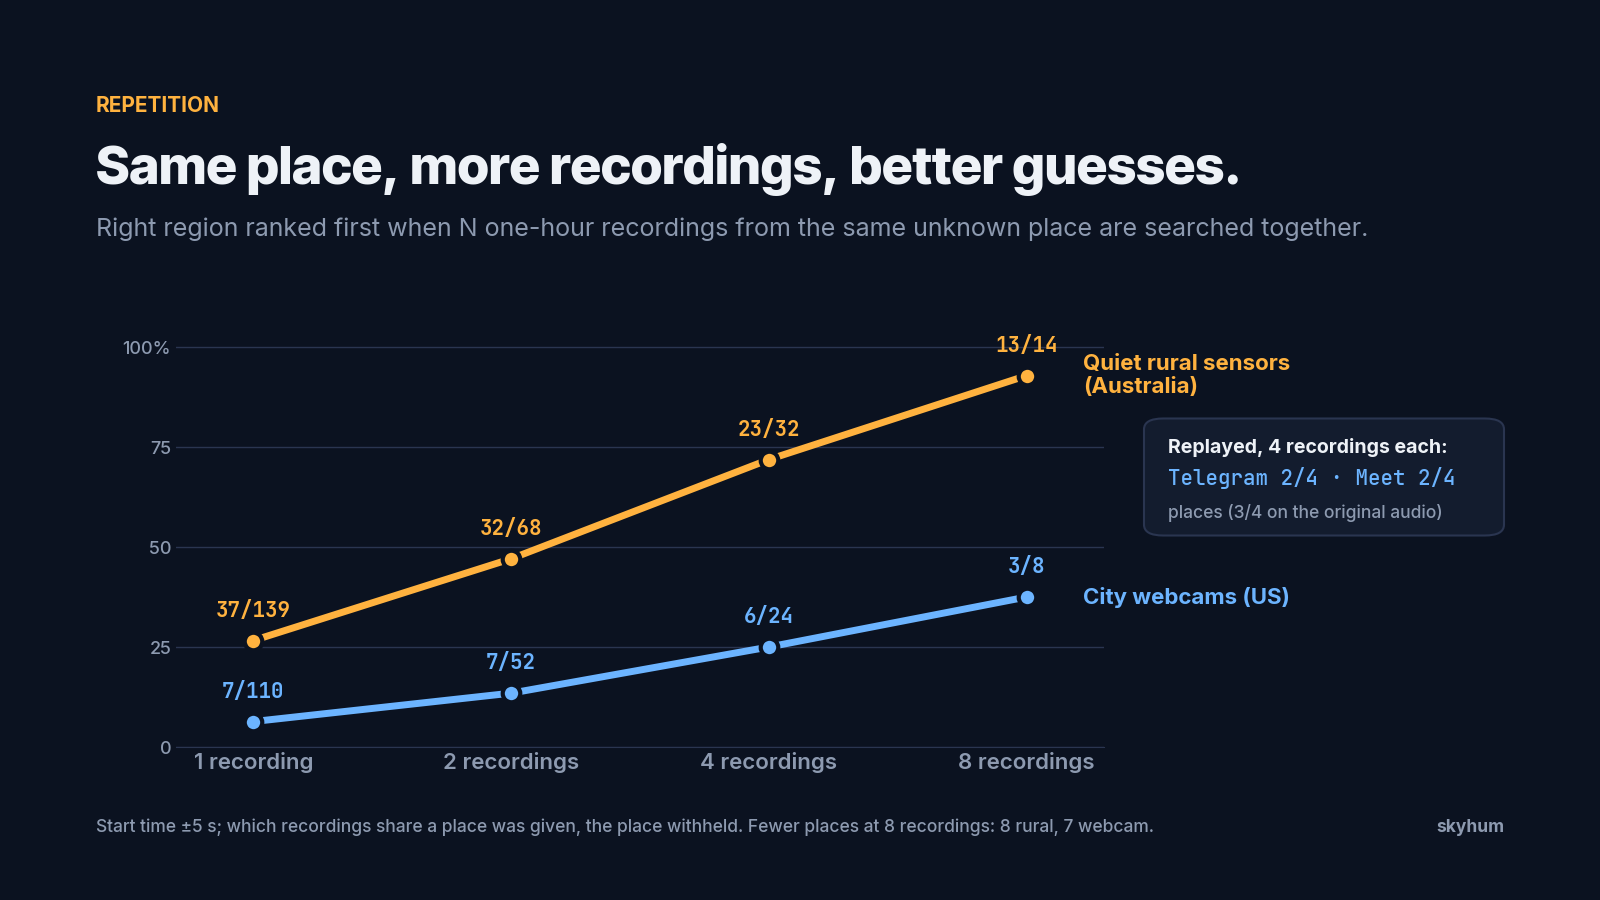 Right region named first from 1, 2, 4 and 8 one-hour recordings of the same unknown place. Rural Australian sensors: 37/139, 32/68, 23/32, 13/14. US city webcams: 7/110, 7/52, 6/24, 3/8. Replayed through Telegram and Meet at 4 sessions: Telegram 2/4 and Meet 2/4 site groups, against 3/4 on the original audio. Fewer sites at 8 sessions: 8 rural, 7 webcam.
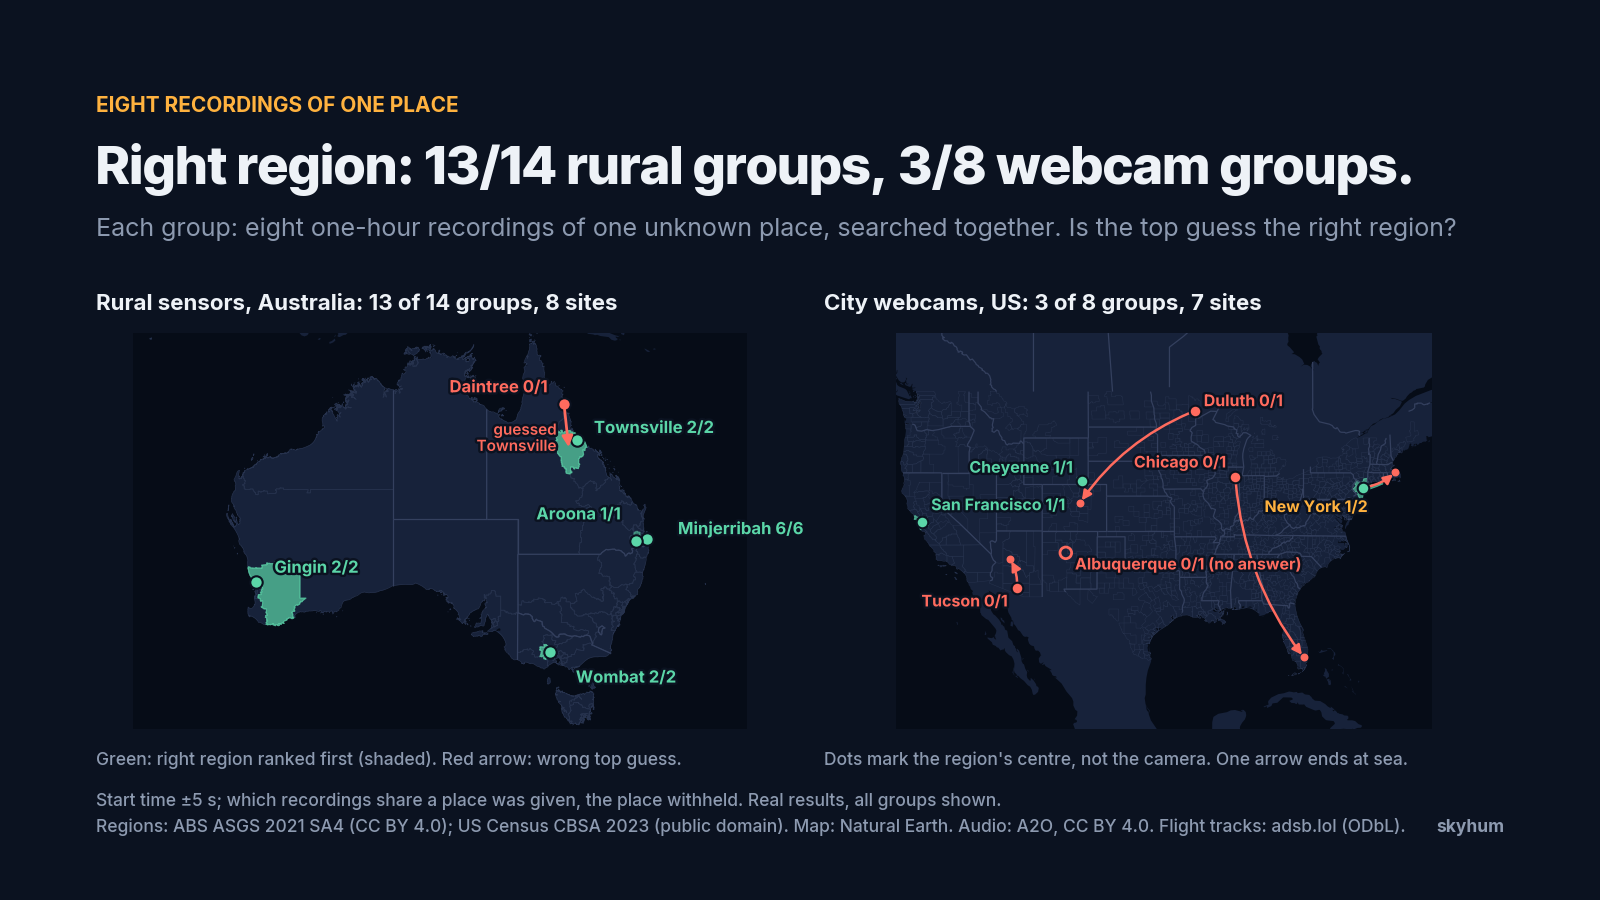 Where the eight-recording results landed, on maps. Australia: 13 of 14 groups ranked the right region first, from 8 sensor sites; the one miss was a far-north Queensland group that named Townsville. United States: 3 of 8 webcam groups were right, from 7 sites; the misses named Denver for Duluth, Prescott Valley for Tucson, Miami for Chicago, and a point at sea for one New York group, and Albuquerque gave no answer. Markers sit at region centres, not at the cameras.
The largest groups came from too few sites to put much weight on the exact rates. Pooling hours also sharpened the position: with the metro known and no clock, the share within 2 km rose from 10% for one hour to 24% for four and 52% for eight (35 sets). With a ±30 s clock it went from 15% to 47% and 67% (11 sets). Which hours shared a site was given, and we couldn’t measure how often these pooled answers were confidently wrong. In the call tests, grouping four hours per site gave the right metro for 2 of 4 sites on each app, Telegram and Meet, against 3 of 4 on the same audio before sending. Our sample for that comparison was just four sites.
Meetings have the one thing podcasts don’t: a clock
Every country-wide result above assumes we knew when the recording started, to within five seconds. A meeting hands an analyst that for free: the start time sits in the calendar entry, the join log or the cloud recording’s timestamp, usually to the second. A podcast or public event recording usually carries only a publish date or a rough window.
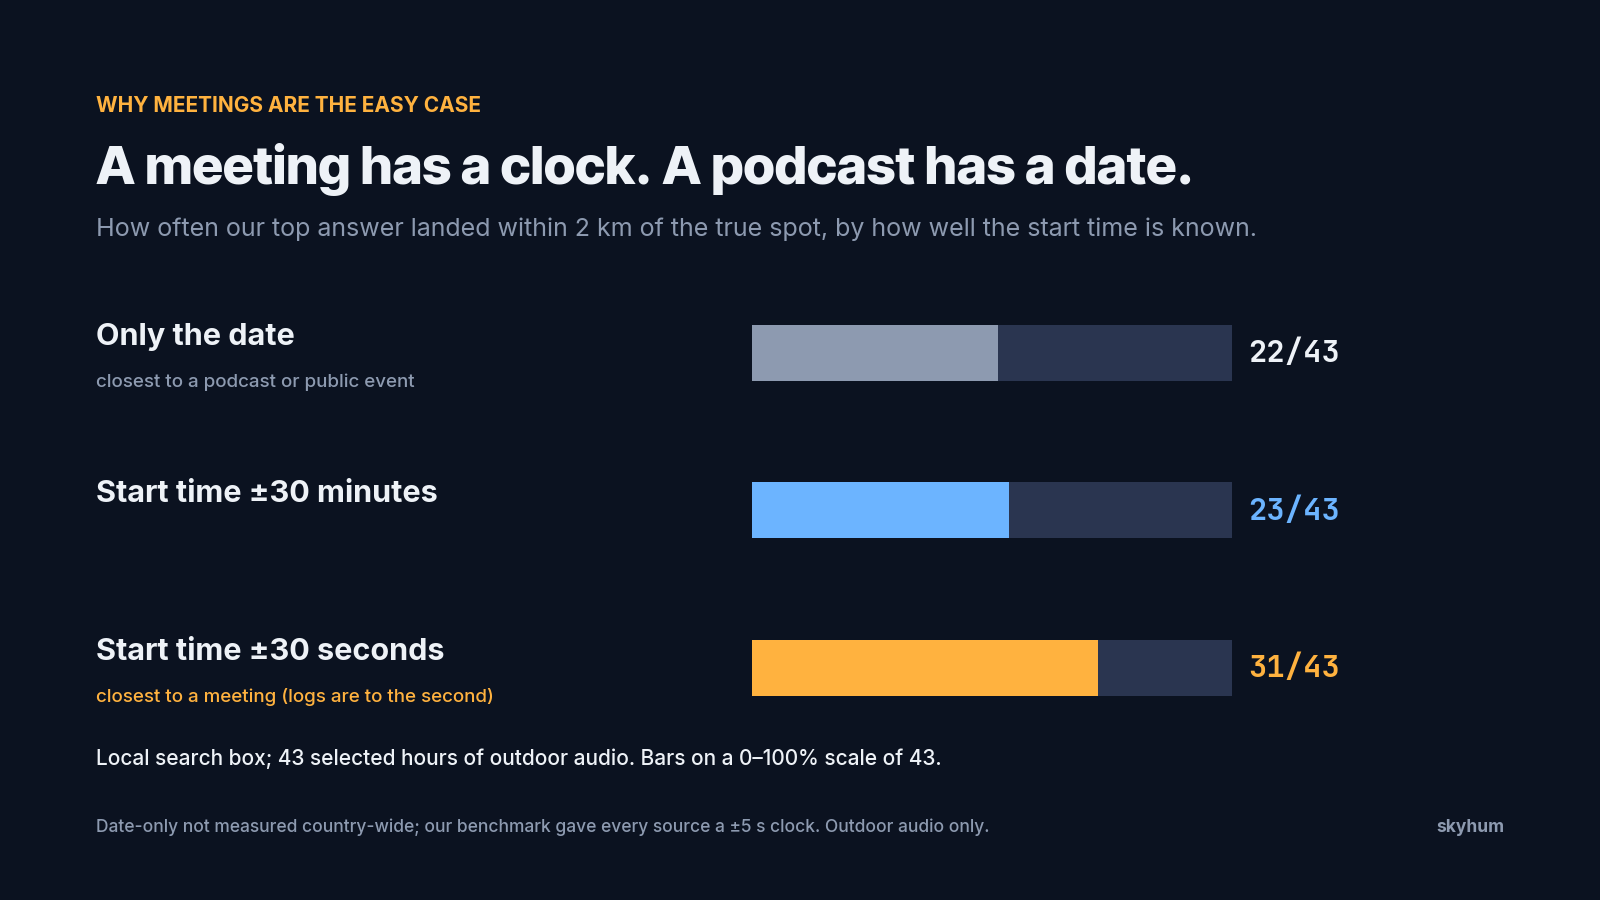 Top answer within 2 km of the true spot, out of 43 selected hours with a local search box, by how well the start time is known: only the date 22; start time within 30 minutes 23; within 30 seconds 31. The date-only row is closest to a podcast or public event; the 30-second row is closest to a meeting.
Going from half an hour to half a minute added 8 hours. Going from a date to half an hour added one. We never ran the country-wide search with only a date, so podcasts and event recordings would score lower than our benchmark shows: we gave every source the five-second clock. A meeting is the closest match to our assumption, with one caveat: we tested outdoor audio only.
A single detected close pass can land within a kilometre
The 75-pass and 70-hour distance results below are conditional on a detected close pass.
We had 75 cases from the rural Australian sensors in which a real aircraft passed close and our loud-event detector caught it. The search had a local box around the true site and assumed the site’s ground height. We knew the start time to about five seconds.
- One of the two mirror points, the first one listed, was within 1 km in 43% of passes and within 2 km in 63%. In 73 of the 75 passes the two points scored identically, so listing one first was arbitrary.
- Counting whichever of the two points was closer, 59% were within 1 km. We used the true site to pick the closer one, so for a single answer this is a ceiling. A listener who reports both points would have one of them within 1 km that often.
- Using the whole hour that contained the pass (70 selected hours), we got within 2 km in 60% of cases. That fell to 51% when we knew the start time only to ±30 s.
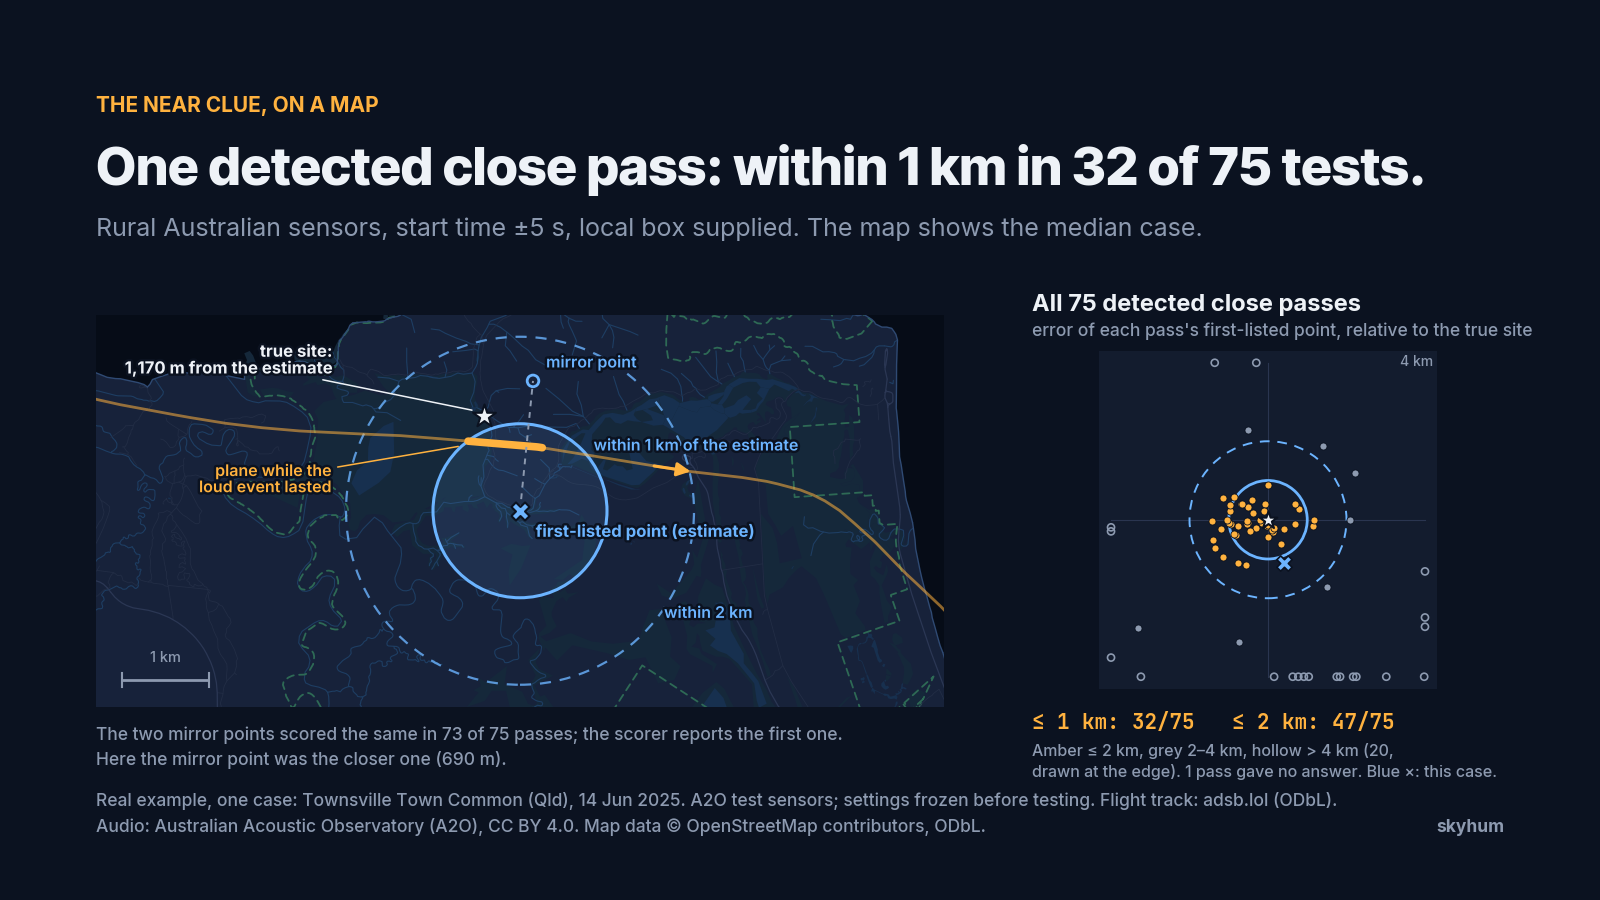 The median close pass on a map. A 1 km and a 2 km circle around the estimated point, the true site 1,170 m away, the plane's track and the stretch flown during the detected loud event. Right: the error of all 75 detected close passes' first-listed points, relative to the true site: 32 within 1 km and 47 within 2 km.
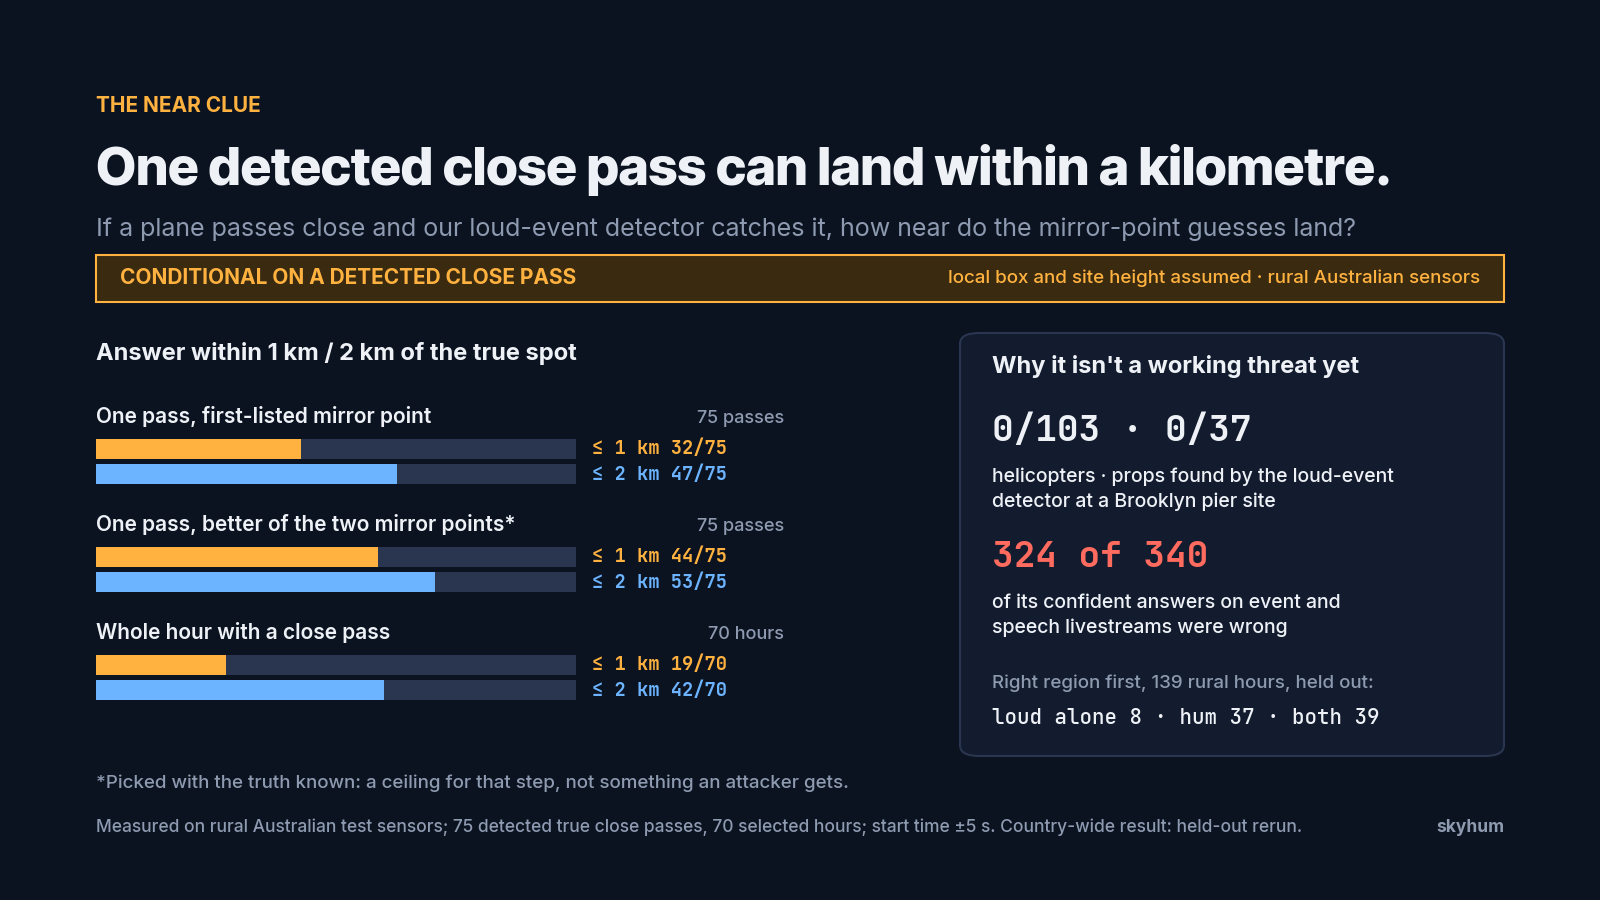 Conditional on a detected close pass; local box and site height assumed; rural Australian sensors. One pass, first-listed mirror point: within 1 km 32/75, within 2 km 47/75. One pass, better of the two mirror points, chosen with the truth known: 44/75 and 53/75. Whole hour with a close pass: 19/70 and 42/70. Why it is not a working threat yet: 0/103 helicopters and 0/37 props found by the loud-event detector at a Brooklyn pier site; on event and speech livestreams, 324 of 340 of its confident 10-minute answers were wrong; right region first in 139 rural Australian hours, held out: loud alone 8, hum 37, both 39.
We could compare the two clues on 54 hours, searched in a local box with the start time known to ±30 s. The hum placed 19 within 2 km and the loud channel placed 14 within that distance, with 4 hours in common. Between them they accounted for 29 of 54, against 19 for the hum alone. We counted that union retrospectively, using the known sites to score each set of answers. We didn’t run a combined system for this comparison.
Three measured limits keep it from working as a general-purpose locator today.
- On event and speech recordings, the loud channel gave a confident answer in 340 ten-minute windows. It was wrong in 324 of them.
- At a Brooklyn pier site with heavy helicopter traffic, the loud-event detector found 0 of 103 helicopters and 0 of 37 props. It was tuned on quiet rural hours, and city noise is a harder problem.
- In the held-out country-wide search, adding the loud channel to the hum barely changed anything. Alone, the loud channel put the right region first for 8 of 139 Australian single hours and 2 of 110 US webcam hours, against 37 of 139 and 8 of 110 for the hum. Combined, the counts were 39 of 139 and 7 of 110. At four and eight sessions the Australian results didn’t move (23/32 and 13/14), and the call tests stayed at 3 of 4 unprocessed and 2 of 4 on each app. (Hum alone scored 8 of 110 on webcams in this rerun, which scores it over a wider candidate set; the 7 of 110 earlier used the hum’s own candidates only.) We chose the weighting on 60 development hours before looking at any of these.
For risk, the ceiling is what matters: on a detected close pass, with a local search area supplied, the geometry worked in our rural test. Detecting close city passes and telling right answers from wrong ones remain open problems for our loud-event detector.
Helicopters: easiest to hear, hardest to detect
In our city sample, helicopters were the passes a labeller most often found (mostly at one Brooklyn pier), and also the passes our blind tone detector most often missed.
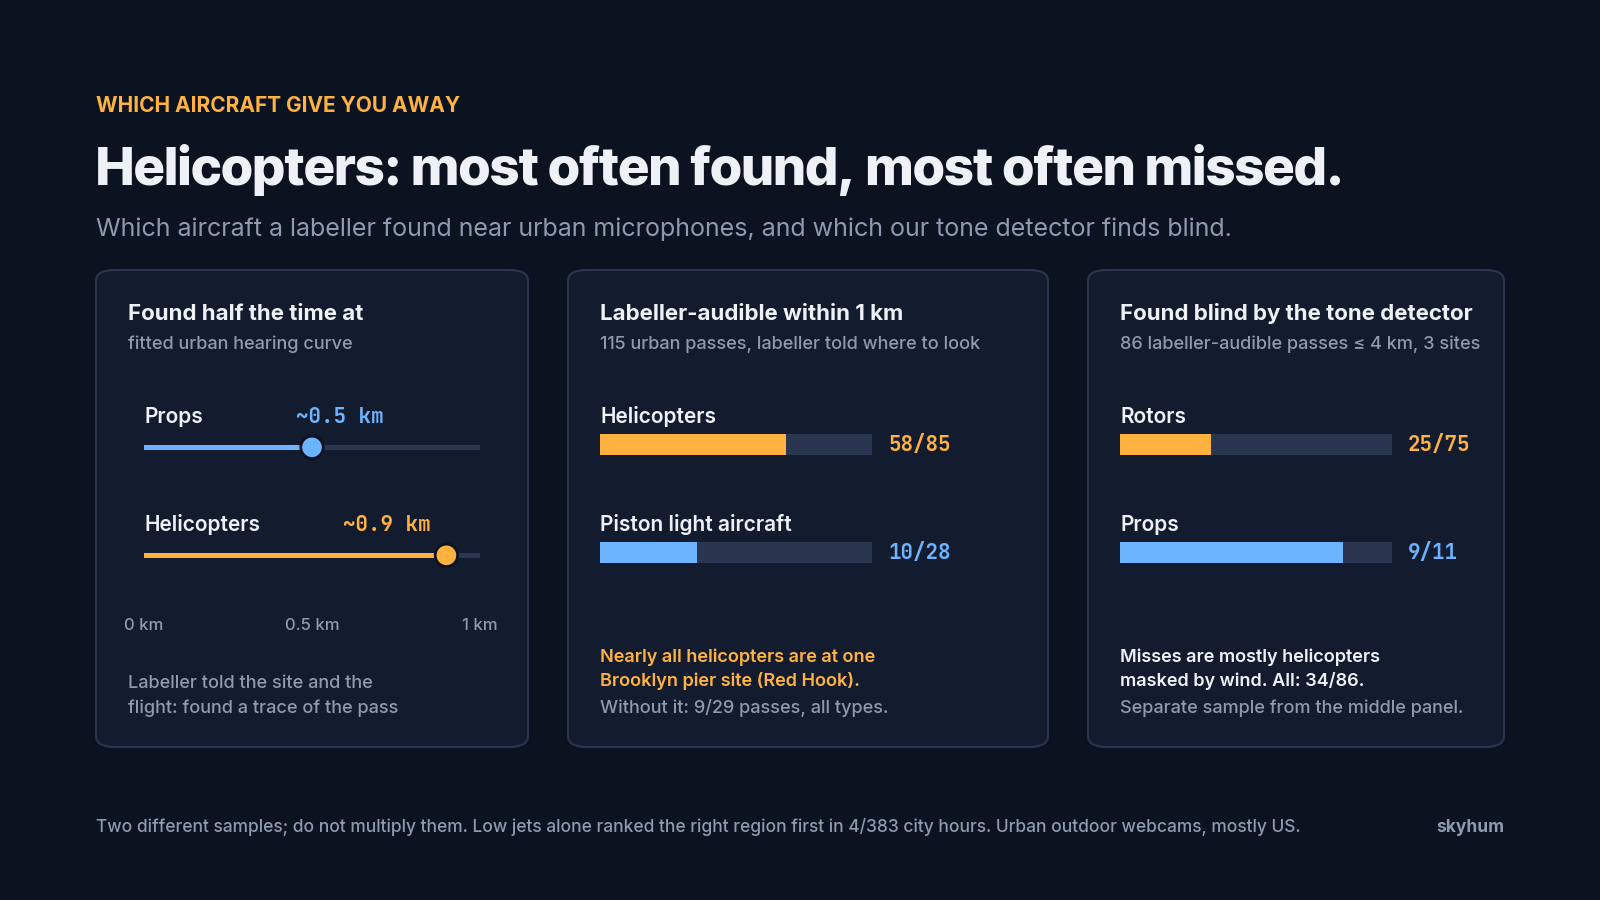 Which aircraft give you away, US city outdoor sites. Found by the told-where-to-look labeller half the time at about 0.5 km for props and 0.9 km for helicopters, from the fitted urban hearing curve. Labeller-audible within 1 km in 115 urban passes, labeller told where to look: helicopters 58/85, piston light aircraft 10/28; nearly all helicopters are at one Brooklyn pier site (Red Hook); without it 9/29 passes, all types. Found blind by the tone detector in a separate sample of 86 labeller-audible passes within 4 km at 3 sites: rotors 25/75, props 9/11, all 34/86; misses are mostly wind-masked helicopters. Separately, low jets alone ranked the right region first in 4/383 city hours.
How far away they can be found. We fitted a hearing curve to an automated relabel of urban webcam audio. On that curve the chance that an automated labeller, told where to look, found the pass falls to one half at about 0.5 km for props and 0.9 km for helicopters.
What’s audible close in. At nine urban webcam sites, 115 scorable passes came within 1 km. An automated labeller given the site and the flight could find a trace of 68 (59%). Of the helicopters, 58 of 85 (68%) were labeller-audible. For piston light aircraft the figure was 10 of 28 (36%). Nearly all the helicopters were at a single pier site in Red Hook, Brooklyn, so the location-bootstrap interval for the helicopter figure runs from 0 to 71%. With Red Hook excluded, 9 of 29 passes were audible across aircraft types.
What the blind tone detector catches. We used a separate sample of 86 labeller-audible passes within 4 km at three sites. Without knowing where to look, our tone detector found 34 (40%), including 9 of 11 props and 25 of 75 rotors. Within 1 km it found 19 of 64 (30%). Most of the passes it missed were helicopters masked by wind. The audibility and blind detection rates come from different samples, so multiplying them would give a misleading rate.
Jets. Low jets alone gave the right region for 4 of 383 city-webcam hours (1%) and 3 of 16 hours beside two test airports. On 219 matched benchmark hours, the hum got 15 right, jets got 4 and both together got 17.
At our default rule, checking a claimed region was easier than finding it
For single US webcam hours, our default check accepted 18 of 110 true region claims (16%). A search from scratch found the right region in 7 of 110. The check also accepted 2 of 110 (1.8%) wrong claims naming the nearest other region (at least 250,000 residents in the US; the nearest other SA4 in Australia). Of 139 Australian sensor hours, the search placed 37 in the right region. The check accepted 52 true claims and 6 of the wrong neighbouring claims.
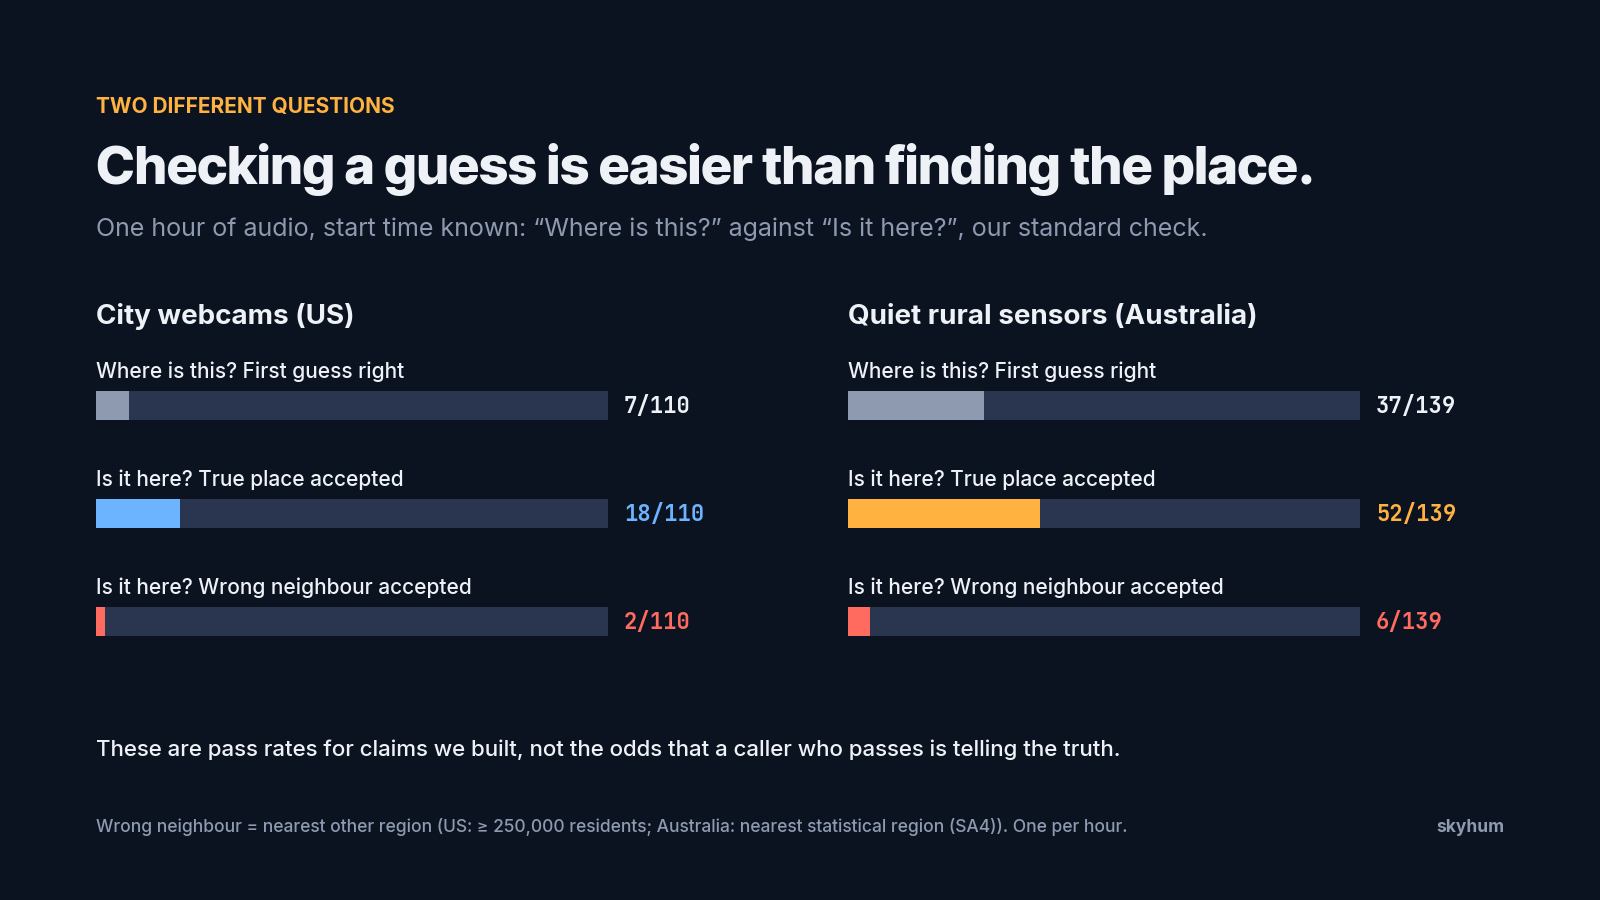 Finding versus checking a claim, one hour, default rule. US city webcams: first guess right 7/110, true place accepted 18/110, wrong neighbour accepted 2/110. Quiet rural Australian sensors: 37/139, 52/139, 6/139. Pass rates for claims we built, not the odds that a caller who passes is telling the truth.
Nearby places can be hard to tell apart. A failed check tells you little, given that the check turned down 92 of 110 true webcam claims. We measured how often it accepted the claims we constructed. To know the odds that a caller who passes is telling the truth, you’d also need to know what people claim.
Modelled odds rose near small airfields
With the metro already known and the start time known to ±30 s, we modelled the chance of placing the mic within 2 km from one quiet outdoor daytime hour. The figures are modelled, and assume every audible pass is detected.
For the median land point in each metro, the estimates ranged from 3.0% in San Francisco to 22% in the Los Angeles basin. The model gave higher figures near small airfields and helicopter routes, including public parks such as Lake Balboa by Van Nuys airport (KVNY) at 54% and The Battery in Manhattan at 58%. Six named spots were modelled at 51–58%.
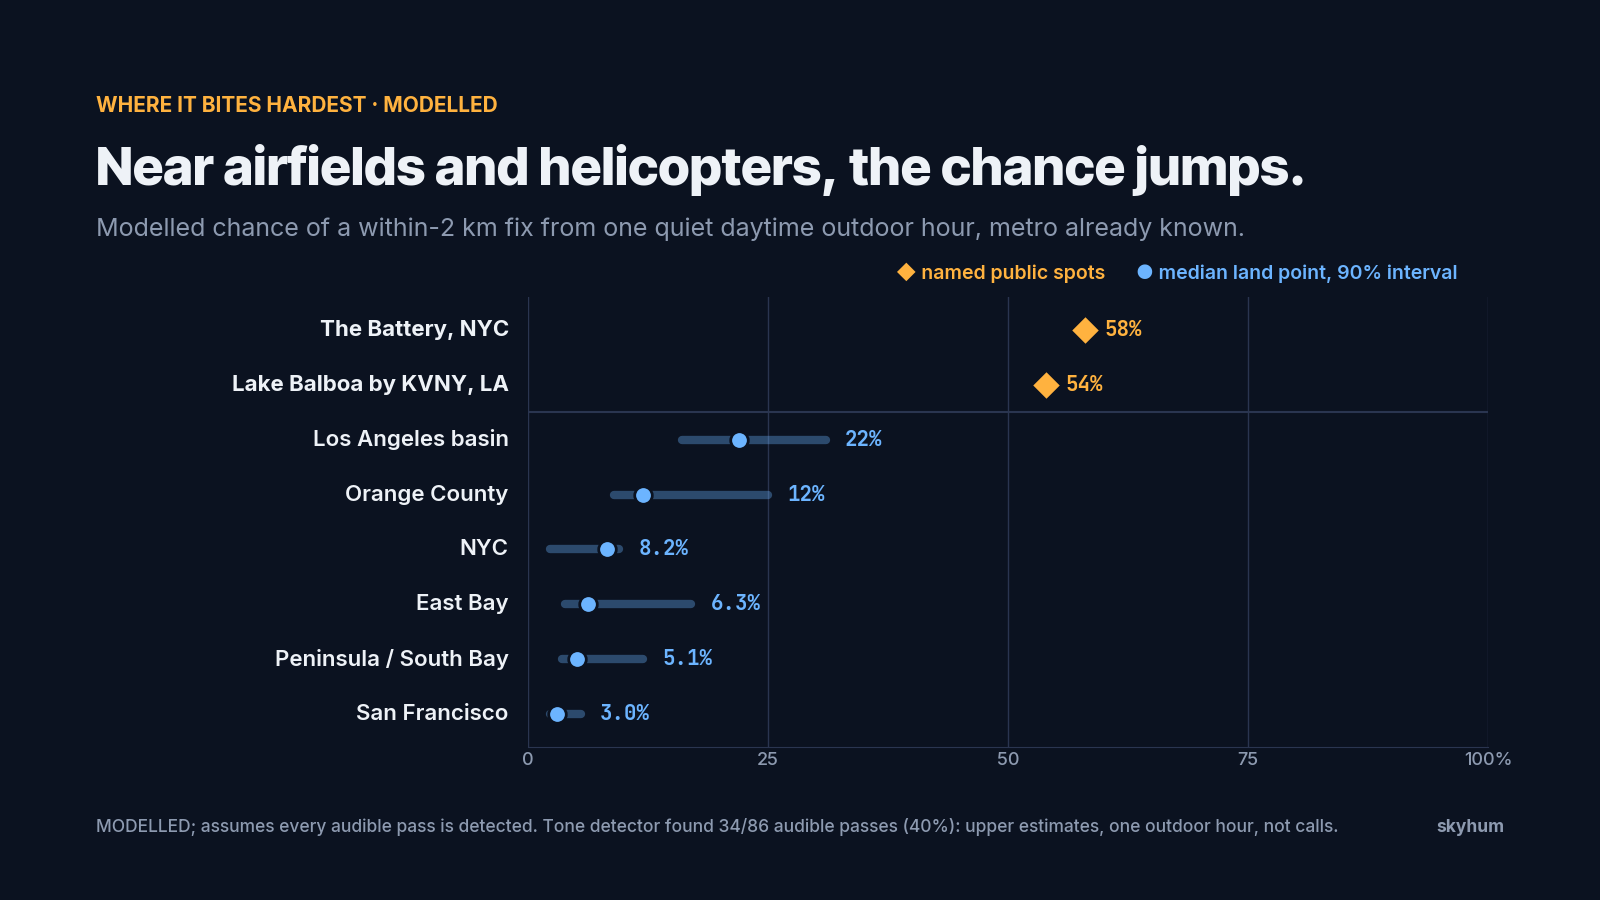 Modelled chance of a within-2 km fix from one quiet daytime outdoor hour, metro already known, assuming every audible pass is detected. Named spots: The Battery, NYC 58%; Lake Balboa by KVNY, LA 54%. Median land points with 90% bootstrap intervals for the median: Los Angeles basin 22% (16–31), Orange County 12% (9–25), NYC 8.2% (2.3–9.5), East Bay 6.3% (3.9–17), Peninsula and South Bay 5.1% (3.5–12), San Francisco 3.0% (2.3–5.5).
Our tone detector found 40% of the labeller-audible passes in a separate sample, so read these as upper estimates under the model’s assumptions, for one outdoor hour of raw microphone audio, not for a call from the park.
With the metro known and the start time known to ±30 seconds, our locator put its top answer within 2 km of the true spot for 31 of 43 selected hours, and within 1 km for 24 of 43. The 43 hours come from seven sites, so the uncertainty is wide. We then tested how often it is confidently wrong, using 20 clock-shifted decoys per hour. At ±30 s, 50 hours got a confident answer and 34 were within 2 km (68%, 95% interval 36–87%). In 9 of the 43 hours with a known aircraft position, the confident answer was wrong, and in 1 of 12 hours with no aircraft at all it still gave one. Raising the confidence bar didn’t help: precision stayed between 68% and 73%. At ±30 minutes it fell to 25 of 49 (51%). The modelled chances above were computed before this locator and haven’t been re-run.
What you can do, and what apps could do
- Mute while you listen. We didn’t test muting itself, but in our replays with no added voice most known passes still came through on Telegram (17 of 19) and Meet (13 of 19), so the open mic is the exposure.
- Take particular care if you regularly join meetings from the same outdoor spot. If someone can tell that several meetings came from the same place, together they carry more risk than any single one.
- Replace the ambient track before publishing sensitive footage. Re-encoding to AAC left the clue intact in our simulation.
Some apps already strip the hum, by accident. Zoom’s default noise removal kept none of our 19 passes, and its “Original sound” mode, built for musicians, brought 17 back. Telegram and Meet kept most of them.
Apps could quiet the band below 400 Hz during speech pauses and still leave the mic open. We simulated this offline on 53 selected quiet rural hours, each with at least two labelled passes and no added voice, with the local area and start time supplied. With untreated audio, 32 of 53 hours were placed within 2 km. With the pause filter, that fell to 4 of 53, with a negligible speech cost on two speech-quality tests (median PESQ-WB 0.02 lower, STOI unchanged). Scrubbing aircraft tones left 17 hours within range. Re-encoding left 32. The pause filter helped little during speech, and some loud passes remained detectable under every measure. This was a simulation, not a real app, and real platform pipelines may behave differently.
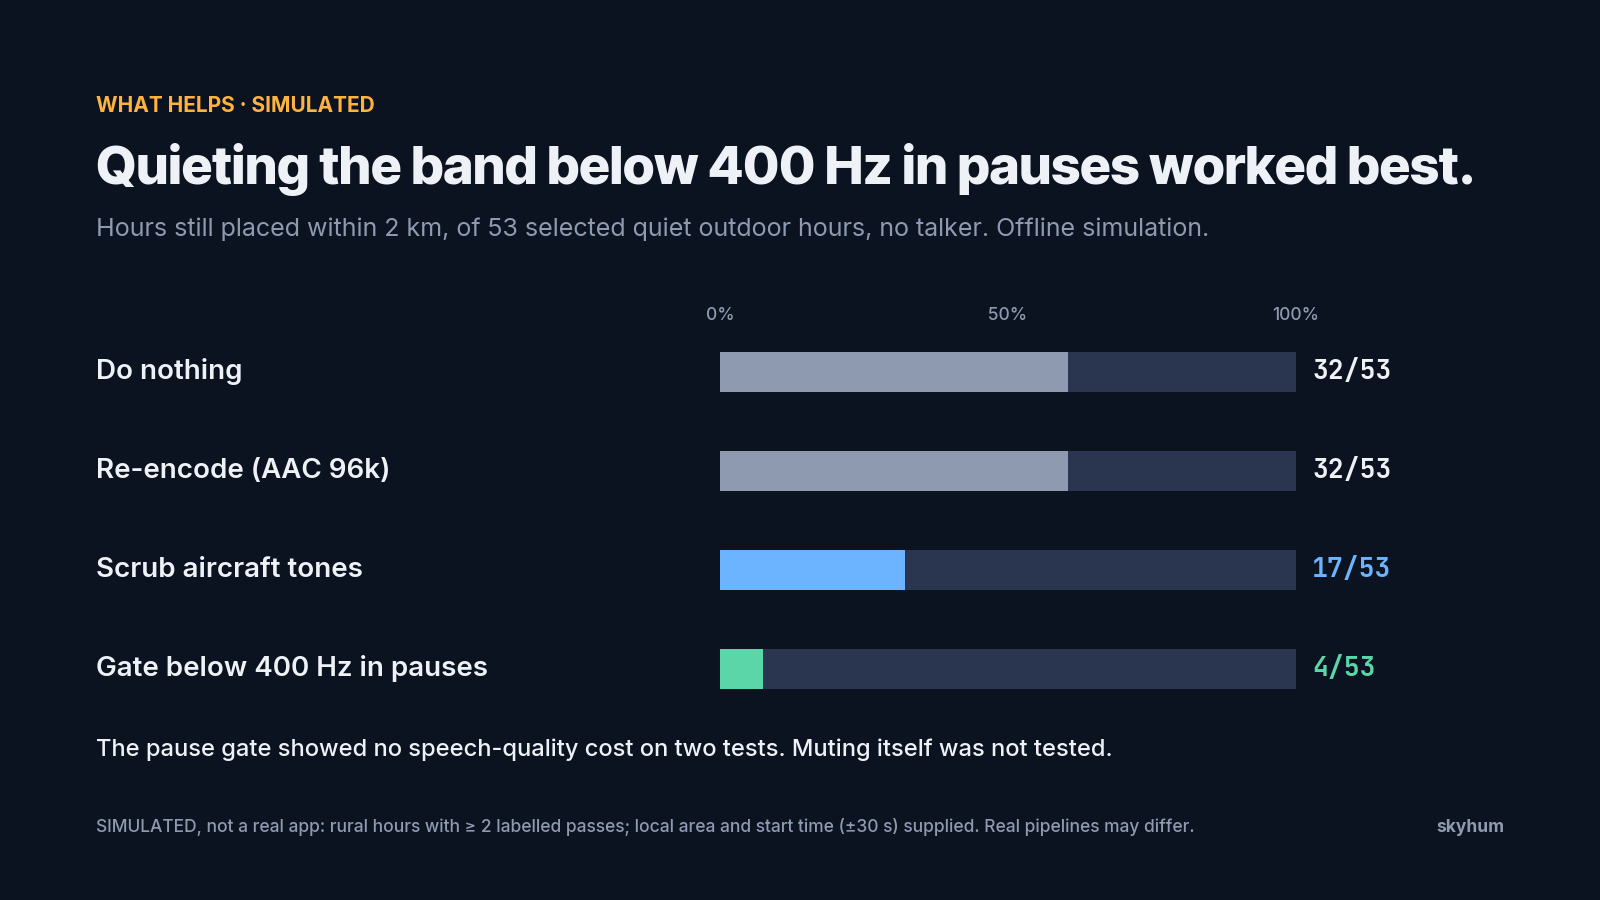 Simulated mitigations: hours still placed within 2 km out of 53 selected quiet outdoor hours, no talker. Do nothing 32/53, re-encode (AAC 96k) 32/53, scrub aircraft tones 17/53, gate the band below 400 Hz in pauses 4/53. Offline simulation, not a real app.
We tested only the US and Australia. We haven’t measured how well public flight history covers small propeller aircraft and helicopters elsewhere, so we make no claim about other countries.
How we tested, and what the numbers cover
Sources. We used public recordings with known locations from US outdoor webcams, event and speech livestreams, and rural Australian acoustic sensors. The country search never received the site coordinates. We used known sites for scoring, some clock calibration, informed pass labels and the local-area and truth-assisted tests described below. None of the recordings came from live meetings.
Clocks. Country-wide searches assumed a start time known to within five seconds. Some clocks were calibrated at the known site. The mitigation simulations used ±30 s. The local-area confidence test used each recording’s own metadata clock, which was looser for most uploads.
Calls. We fed audio digitally into desktop clients. The four call-test sites favoured audible aircraft. Of their 16 hours, 9 had at least two labelled passes, against 11 of all 110 webcam hours. We have no measured success rate for an ordinary indoor or mobile caller. We also have no real cellular or FaceTime result.
Near-pass results are conditional on a detected true close pass, with a local box and site height assumed. We used the true location to choose the better mirror point and counted the 29-of-54 union retrospectively.
Modelled and simulated results carry those labels in the text. We modelled the metros and named spots assuming every audible pass was detected. We simulated the mitigations.
Confidence. In a separate local-area test on 634 public recordings, 18 fixes passed both confidence checks. Of those, 14 were within 2 km and 4 fell outside that distance.
Bounds. The success counts from single-answer searches are lower bounds for our implementation on these inputs. Better engineering could raise the success counts on the same audio. False-accept rates and baselines can move either way. We never tested a two-city choice (for example Bay Area versus Los Angeles) directly.
Credit. The far-hum idea is colsto’s: I discovered a sound that leaks your exact location. We started from AlanBacker/audio-flyover-geolocation, an independent implementation with no affiliation to colsto. The trained models, the real-recording benchmark and the faster search are our own additions.
Data credits. Audio from the rural Australian sensors: Australian Acoustic Observatory: A Network to Monitor Biodiversity. Project Team, with funding from the Australian Government through the Australian Research Council (LE170100033) (2018). Brisbane, QLD: QUT. www.acousticobservatory.org. Licensed under CC BY 4.0. We modified the data: the spectrograms, loudness curves and replayed clips in this article were derived from it. The data comes with no warranty, and neither QUT, the participating organisations nor the ARC are liable for our use of it. Flight tracks: adsb.lol (ODbL). Maps: © OpenStreetMap contributors (ODbL), Natural Earth, ABS ASGS 2021 SA4 (CC BY 4.0), US Census CBSA 2023.
Open source. The skyhum tool, its trained detector and the code to reproduce these numbers are open source at https://github.com/bojieli/skyhum (alpha), with derived features (no audio) for the public webcam hours in the v0.2.0-alpha release. It is for research and defence, not for locating private individuals. Benchmark metadata is links only, never audio.