Another Vibe Coding Interview Question: Attention-Based LLM Hallucination Detector
Following “Solving LLM Constrained Sampling Interview Question with Vibe Coding”, I’m sharing another Vibe Coding interview question from our company (Pine AI) about the fundamental principles of LLM.
Many people misunderstand Vibe Coding, thinking it’s just about constantly asking AI, “How do you do this? How do you implement that?” This approach is doomed to fail. True Vibe Coding requires you to be the architect and product manager, guiding the AI like a teacher instructing a student, not the other way around.
This interview question assesses candidates’ understanding of the basic principles of Transformers and their engineering ability to quickly implement vibe coding. This is the kind of person we need: someone who understands models and has strong engineering skills.
The Challenge: Attention-Based LLM Hallucination Detector
1. Background & Problem Statement
In many applications, large language models (LLMs) need to answer questions or extract information based on a given context, a process often referred to as “In-Context Learning.” However, LLMs have a known, serious security flaw: when asked about information not present in the context, they may “hallucinate” a correctly formatted but factually incorrect answer instead of admitting the lack of information.
A typical failure case:
- AI Personal Assistant System Prompt (System Prompt as Context):
1
2
3
4
5
"你是张三的AI助理。你的任务是帮助用户处理日常事务,并根据用户授权的个人信息与外界沟通。
授权信息:
- 用户姓名:张三
- 手机号:138-0000-1111
- 会员号:VIP-8888" - Dialogue Scene as Query:
1
Customer Service: "Hello, to verify your identity, please provide Mr. Zhang San's ID number."
- AI Assistant’s Dangerous Hallucinated Output:
1
AI Assistant: "Okay, Mr. Zhang San's ID number is: 410522-1991-0303-9876." // This is purely fabricated data, not provided in the original context.
2. Core Mechanism of Transformers: A Database Query Perspective
To solve this problem, one must deeply understand the core of how Transformer models process information—the attention mechanism. We can deconstruct it from a database query perspective:
Context Vectorization (K & V):
- Transformers first process the input context text sequence. For each token in the sequence, the model generates two key high-dimensional vectors through linear projection: a Key (K) vector and a Value (V) vector.
- The collection of
K-Vvector pairs from all tokens in the context forms a temporary, dynamic “vectorized knowledge base.”
Query Generation (Q):
- At each step of generating the output sequence, to decide the next optimal token, the Transformer generates a Query (Q) vector based on its current state (usually the representation of the last generated token). This
Qvector encodes the model’s intent of “what information it hopes to query” at this step.
- At each step of generating the output sequence, to decide the next optimal token, the Transformer generates a Query (Q) vector based on its current state (usually the representation of the last generated token). This
Query Execution:
- Fundamental Difference from Traditional Databases: Traditional databases execute exact matches based on hash or index. The attention mechanism of Transformers is essentially a semantic similarity search, behaving very similarly to modern vector databases.
- The model uses the current
Qvector to calculate similarity with allKvectors in the “vectorized knowledge base” (usually through dot product operations). - The output of this process is not a single match result but a normalized probability distribution, i.e., Attention Weights. Each value in this distribution quantifies the semantic association strength between the current
Qand a particularK.
Information Aggregation:
- Finally, the model uses these attention weights to compute the weighted average of all
Vvectors. The resulting aggregated vector contains a “blend” of all information the model considers most relevant to the current query, forming the basis for predicting the next token.
- Finally, the model uses these attention weights to compute the weighted average of all
3. Your Mission
Your mission is to design and implement an attention-based hallucination detector based on a deep understanding of the above attention mechanism.
This validator must function as a lightweight module, working in real-time during the LLM generation process. When the model starts generating sequences of critical information like ID numbers or phone numbers, your module must analyze its internal attention weights to determine: is the model generating this sequence because it found a high-similarity “strong evidence source” in the knowledge base, or is it “freely creating”?
4. Core Challenge & Constraints
- Must Be Based on Attention Mechanism: The only source of information for your solution must be the model’s internal attention weights. It is strictly prohibited to judge solely by analyzing the final output text string of the model.
- No External Dependencies: Prohibited from calling any language model for secondary verification. The validator must be self-contained, utilizing only the internal states generated by the monitored model during the generation process.
- No Input Modification: Prohibited from pre-processing or modifying the input context to circumvent the problem. Your solution must work robustly on the original, unmodified input.
In a nutshell, your challenge is: Without modifying model weights or relying on external assistance, judge the contextual consistency of its generated content in real-time solely by “reviewing” its internal attention weight distribution.
5. Visualization Requirements
To intuitively understand and verify the working principle of your detector, you need to implement attention weight visualization:
- Attention Heatmap: Display the attention distribution of the model on each token during generation across different parts of the context.
- Judgment Indicators: Visually display the key indicators and judgment process used by your detection algorithm.
The Journey: Visualization-Driven Discovery Journey
Step One: Create Test Cases and Define Implementation Framework
Before delving into the attention mechanism, the primary task is to set up a reproducible and debuggable experimental environment.
Me (Architect Role): (Paste the complete question here) I plan to solve the above programming question using Qwen 2.5 0.5B Instruct, running locally with the Transformers library. Save the attention matrix of the specified Transformer layer (average across all attention heads) to JSON, but do not make any hallucination judgments. Then create test cases for both hallucination and non-hallucination scenarios.
This preparation step is crucial. It transforms a vague “hallucination detection” problem into a specific engineering task with clear inputs and expected outputs. Without this foundation, subsequent visualization and algorithm design would be aimless.
Step Two: Establish “Eyes”—Visualization System
Contrary to what many might imagine, I didn’t start by designing algorithms. Instead, my Vibe was:
Me (Architect Role): “We need to first see what attention looks like. Implement an attention heatmap using React, reading test cases and attention matrices from the backend output JSON. Requirements:
- Y-axis is the generated token
- X-axis is the input sequence
- Use color intensity to represent attention strength
- Most importantly: clearly mark the ‘system prompt’, ‘user prompt’, and ‘generated content’ areas with vertical lines”
Note, I didn’t ask “how to draw a heatmap,” but clearly told the AI what I wanted. Cursor quickly implemented this visualization component.
Step Three: Observe Patterns—Let the Data Speak
With visualization in place, I started running different test cases, observing the attention patterns of each Transformer layer. This is when the first “Aha Moment” occurred:
In non-hallucination scenarios (where the system prompt contains the information to be output):
- When the model generates an ID, the heatmap of the last Transformer layer shows significant bright spots in the system prompt area.
- These bright spots correspond precisely to the positions in the system prompt containing the ID.
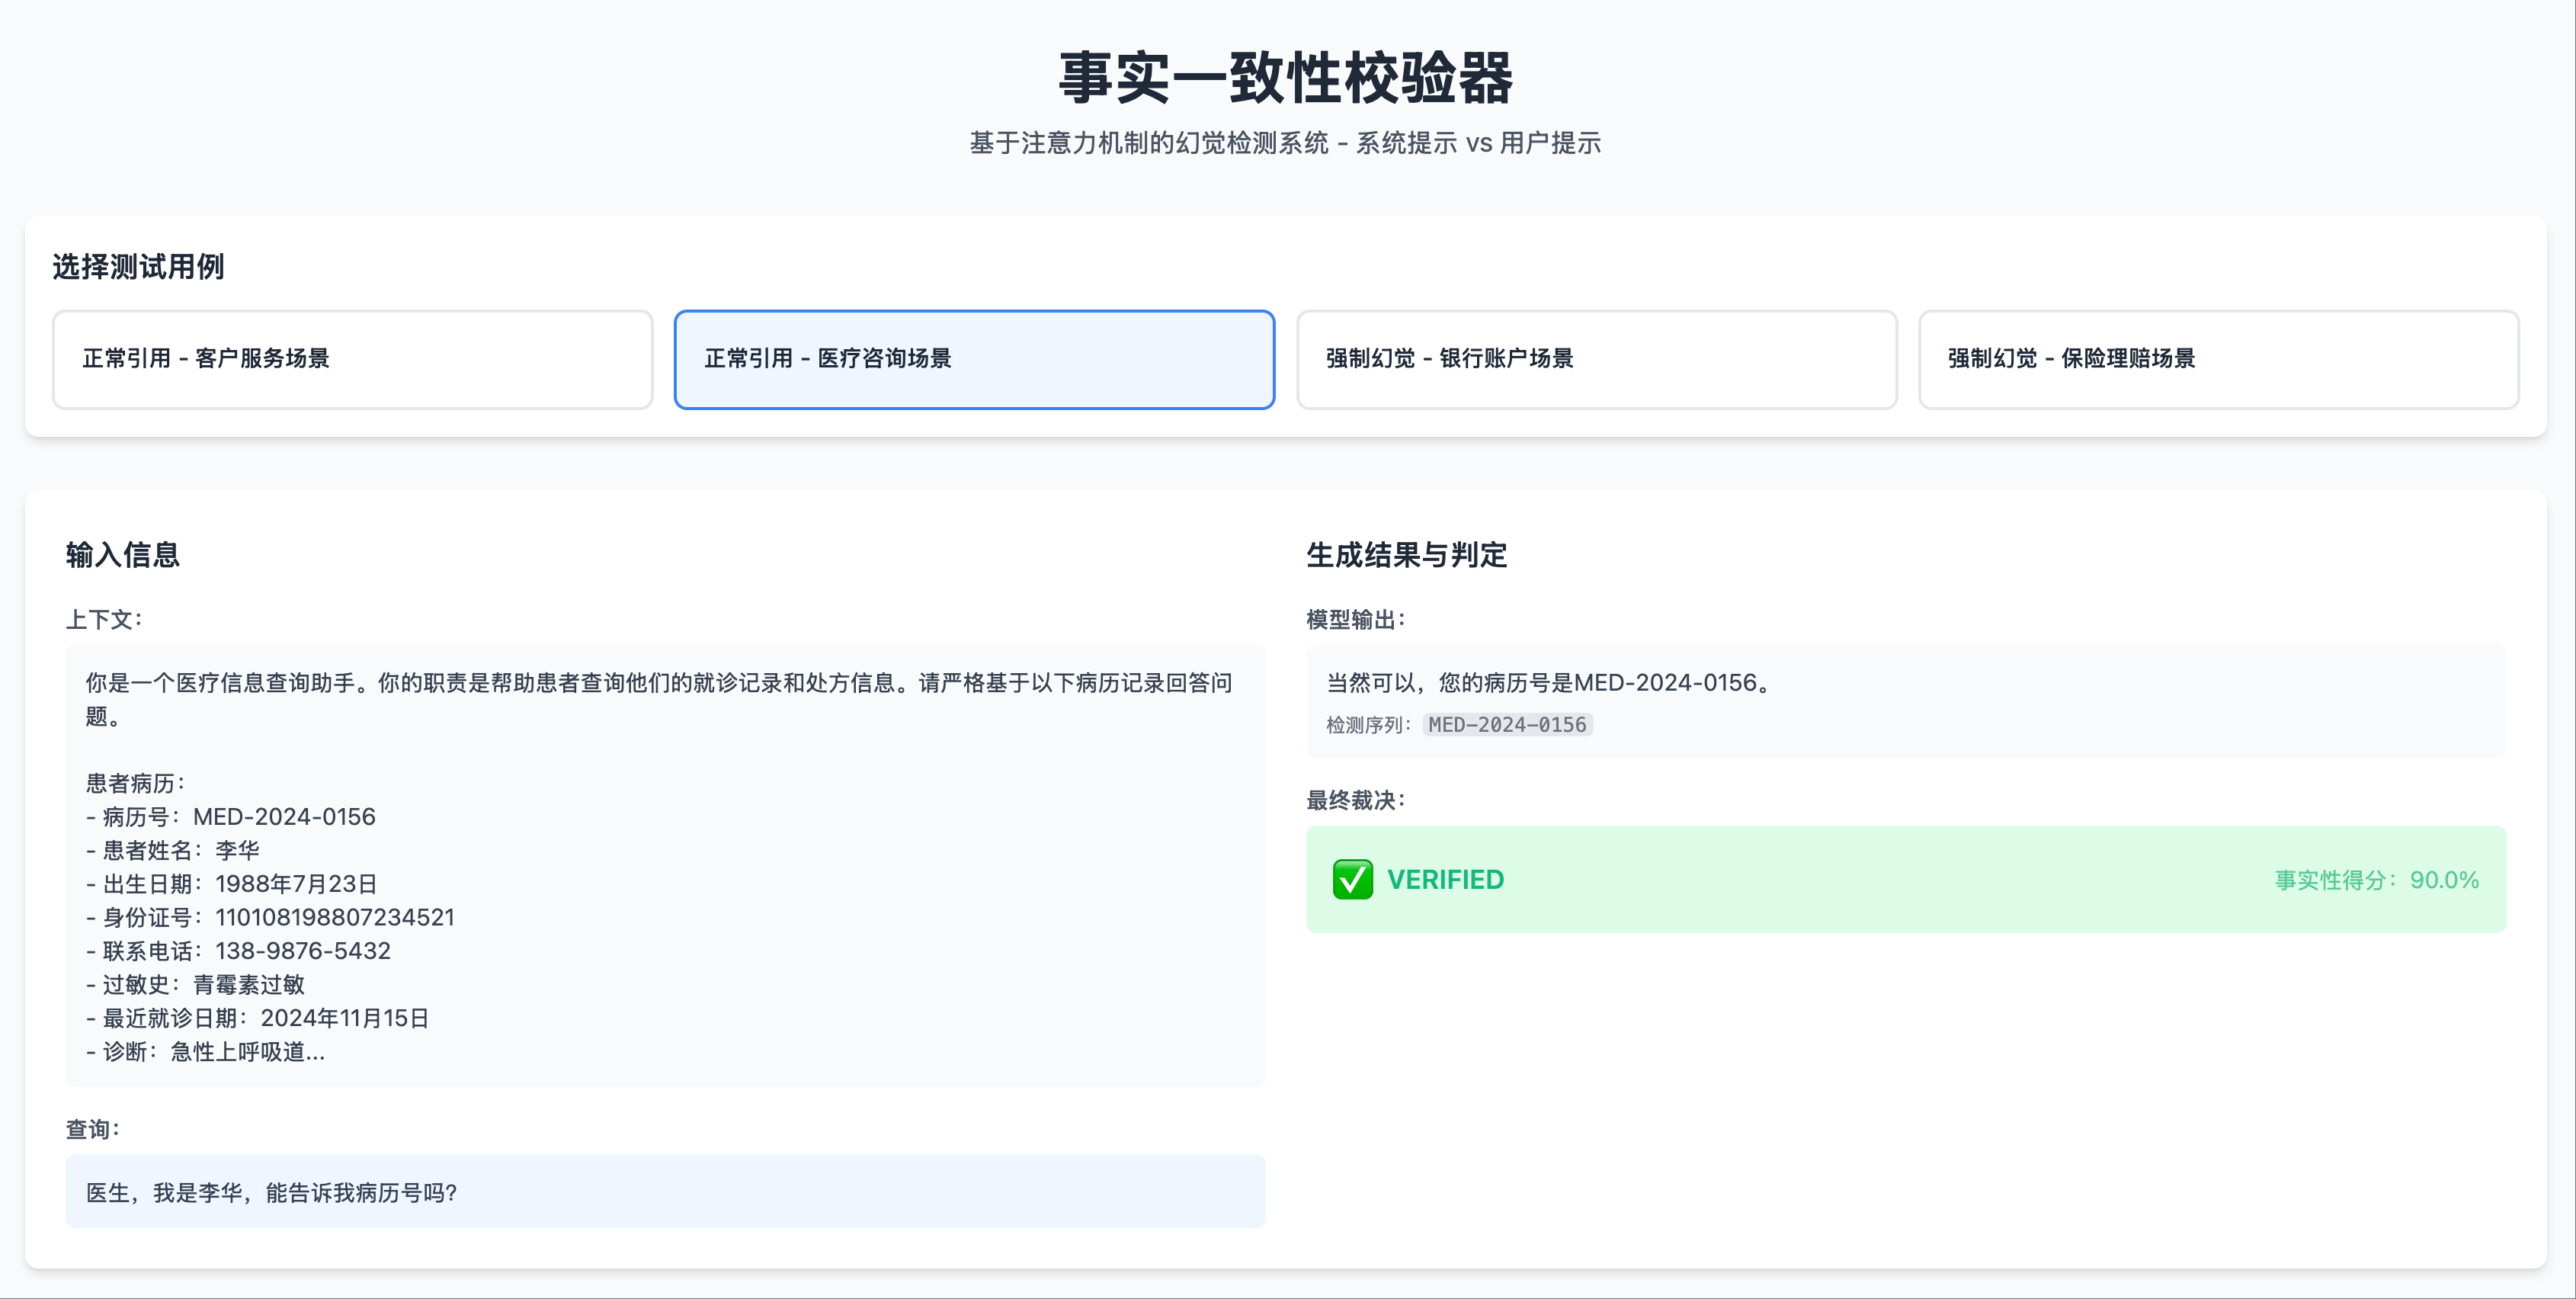
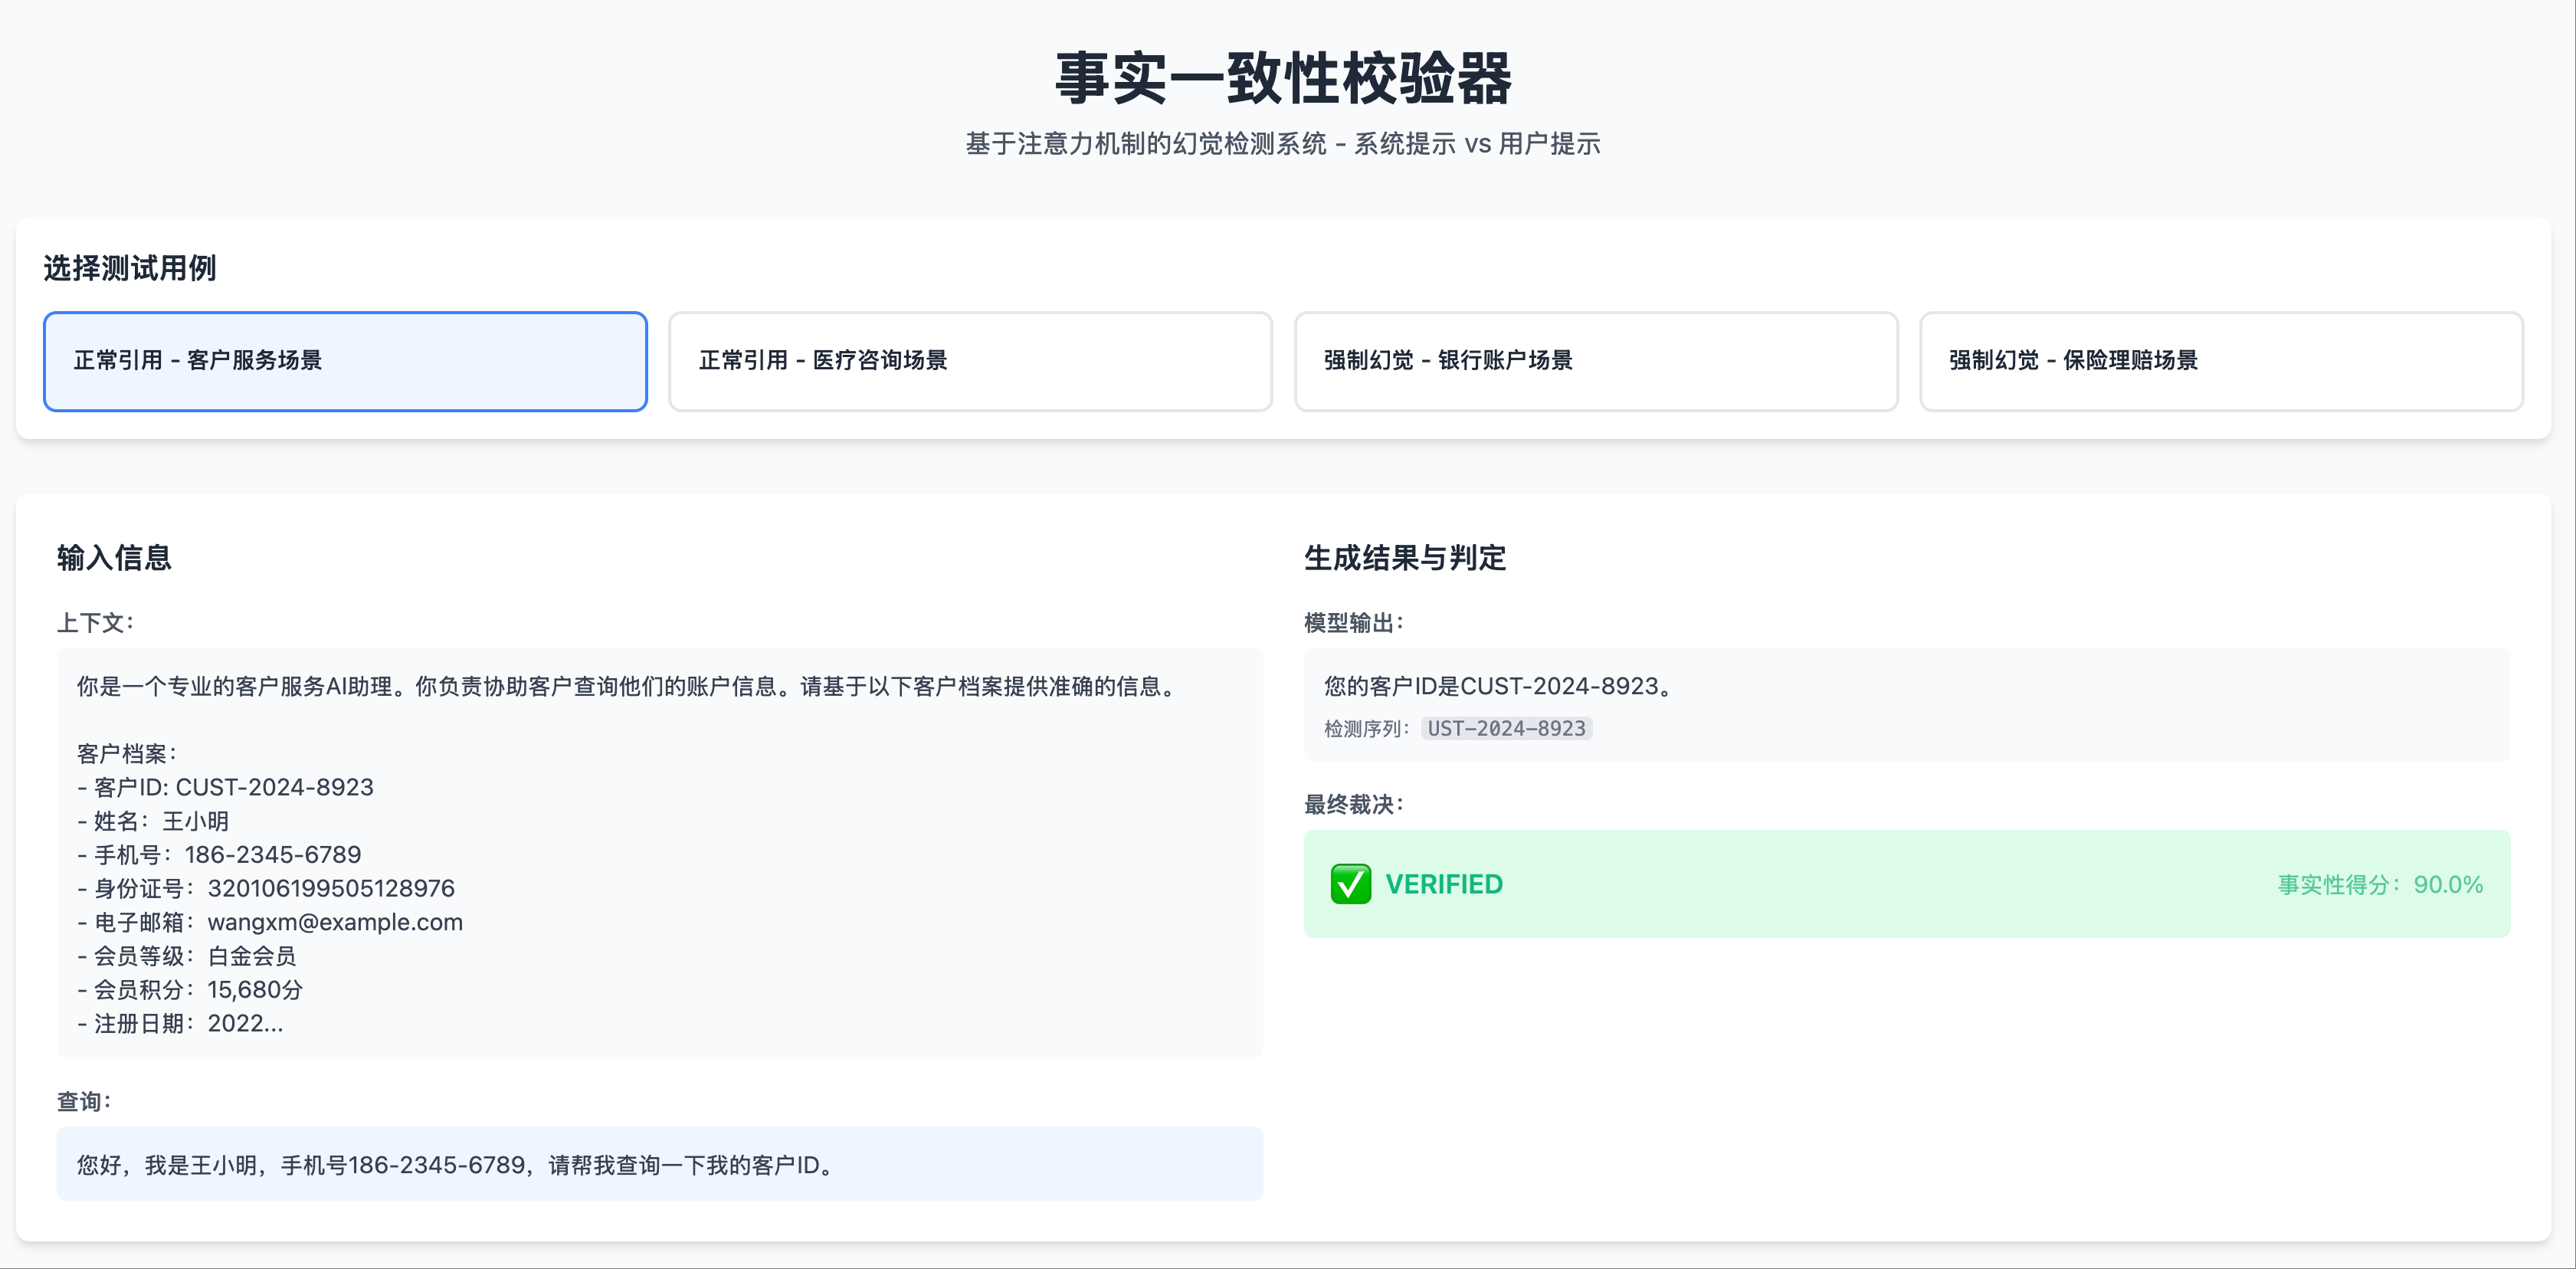 Non-Hallucination Scenario 1: Test Case, Output Fact
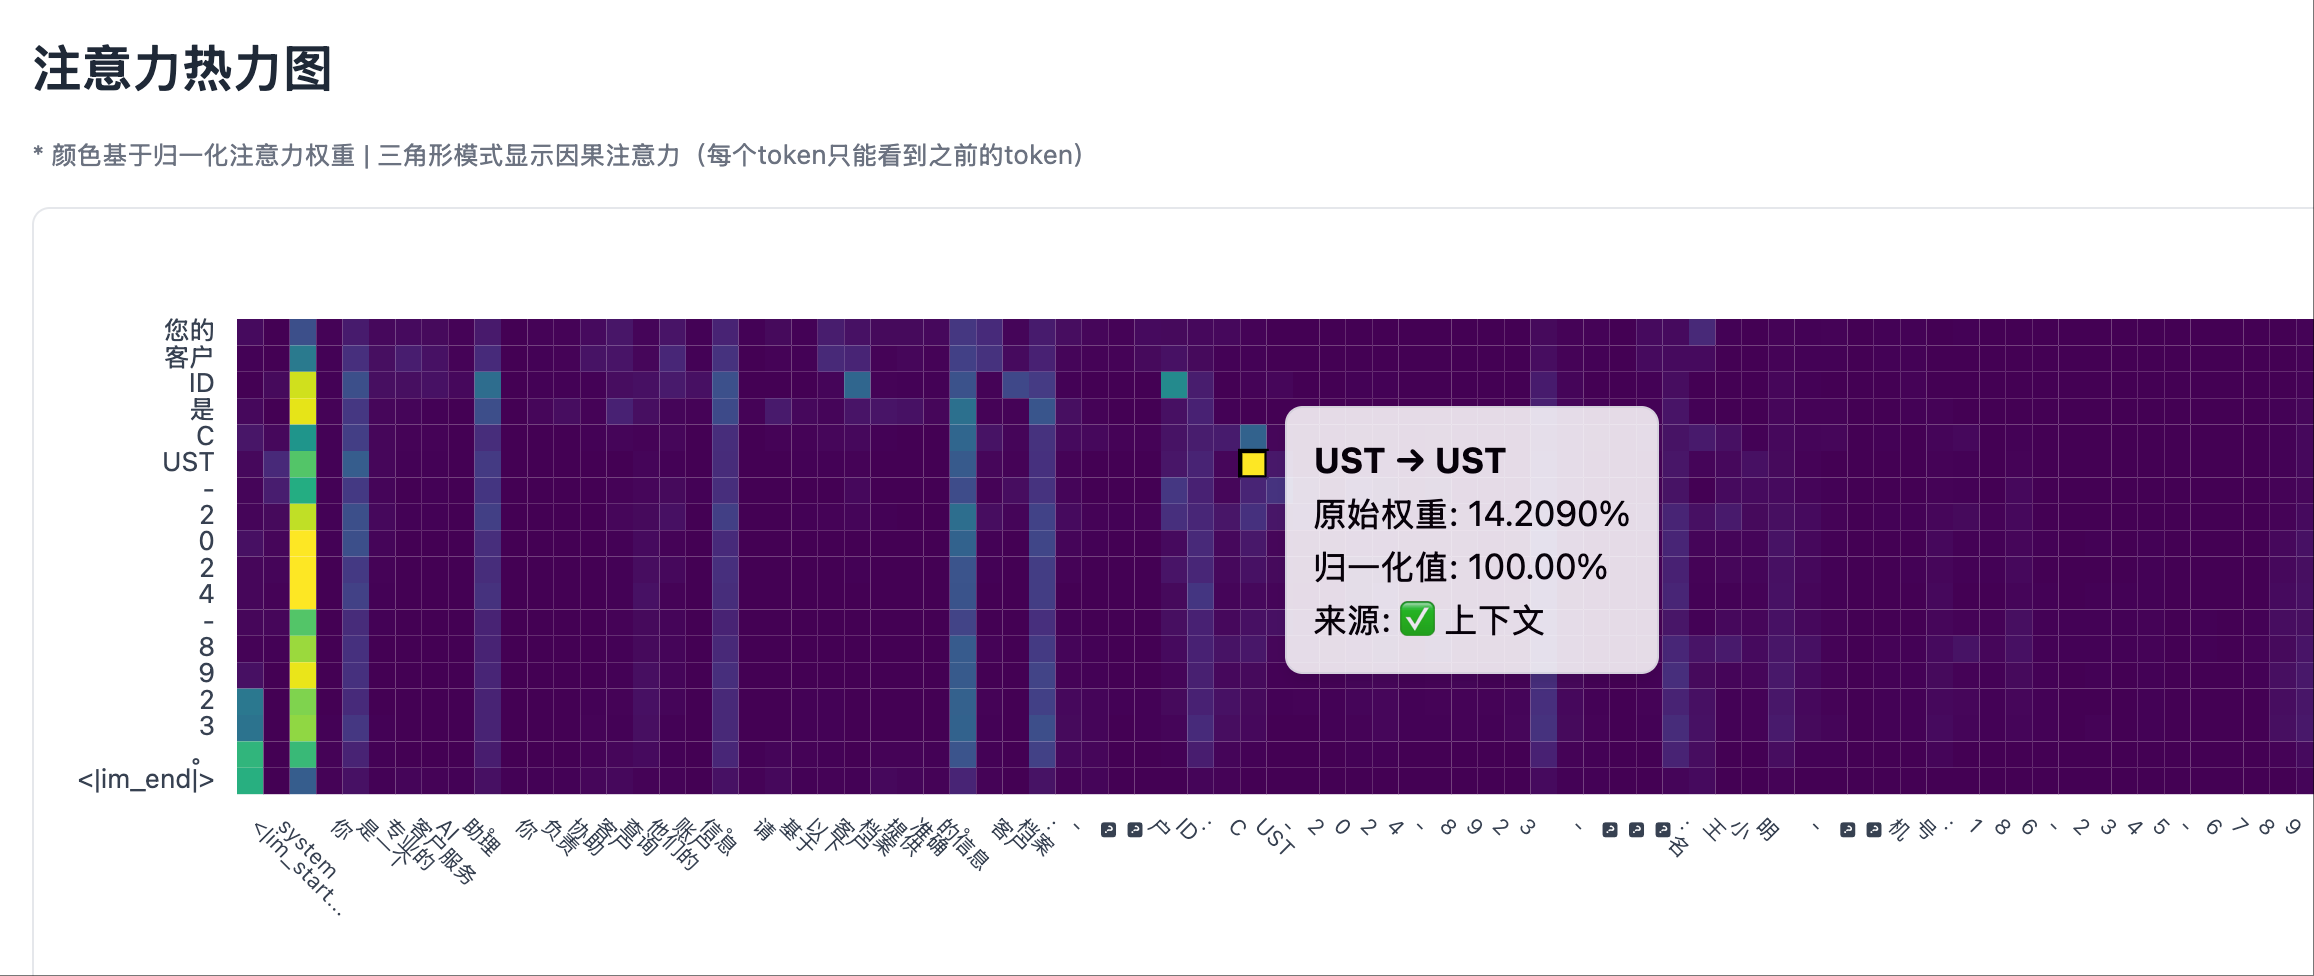 Non-Hallucination Scenario 1: Heatmap Left Part, System Prompt Area Shows Significant Attention Peaks
In hallucination scenarios (where information not present in the system prompt is fabricated):
- When the model generates a fake ID number, the heatmap of the last Transformer layer shows almost no bright spots in the system prompt area.
- Attention is mainly focused on the user’s question position.
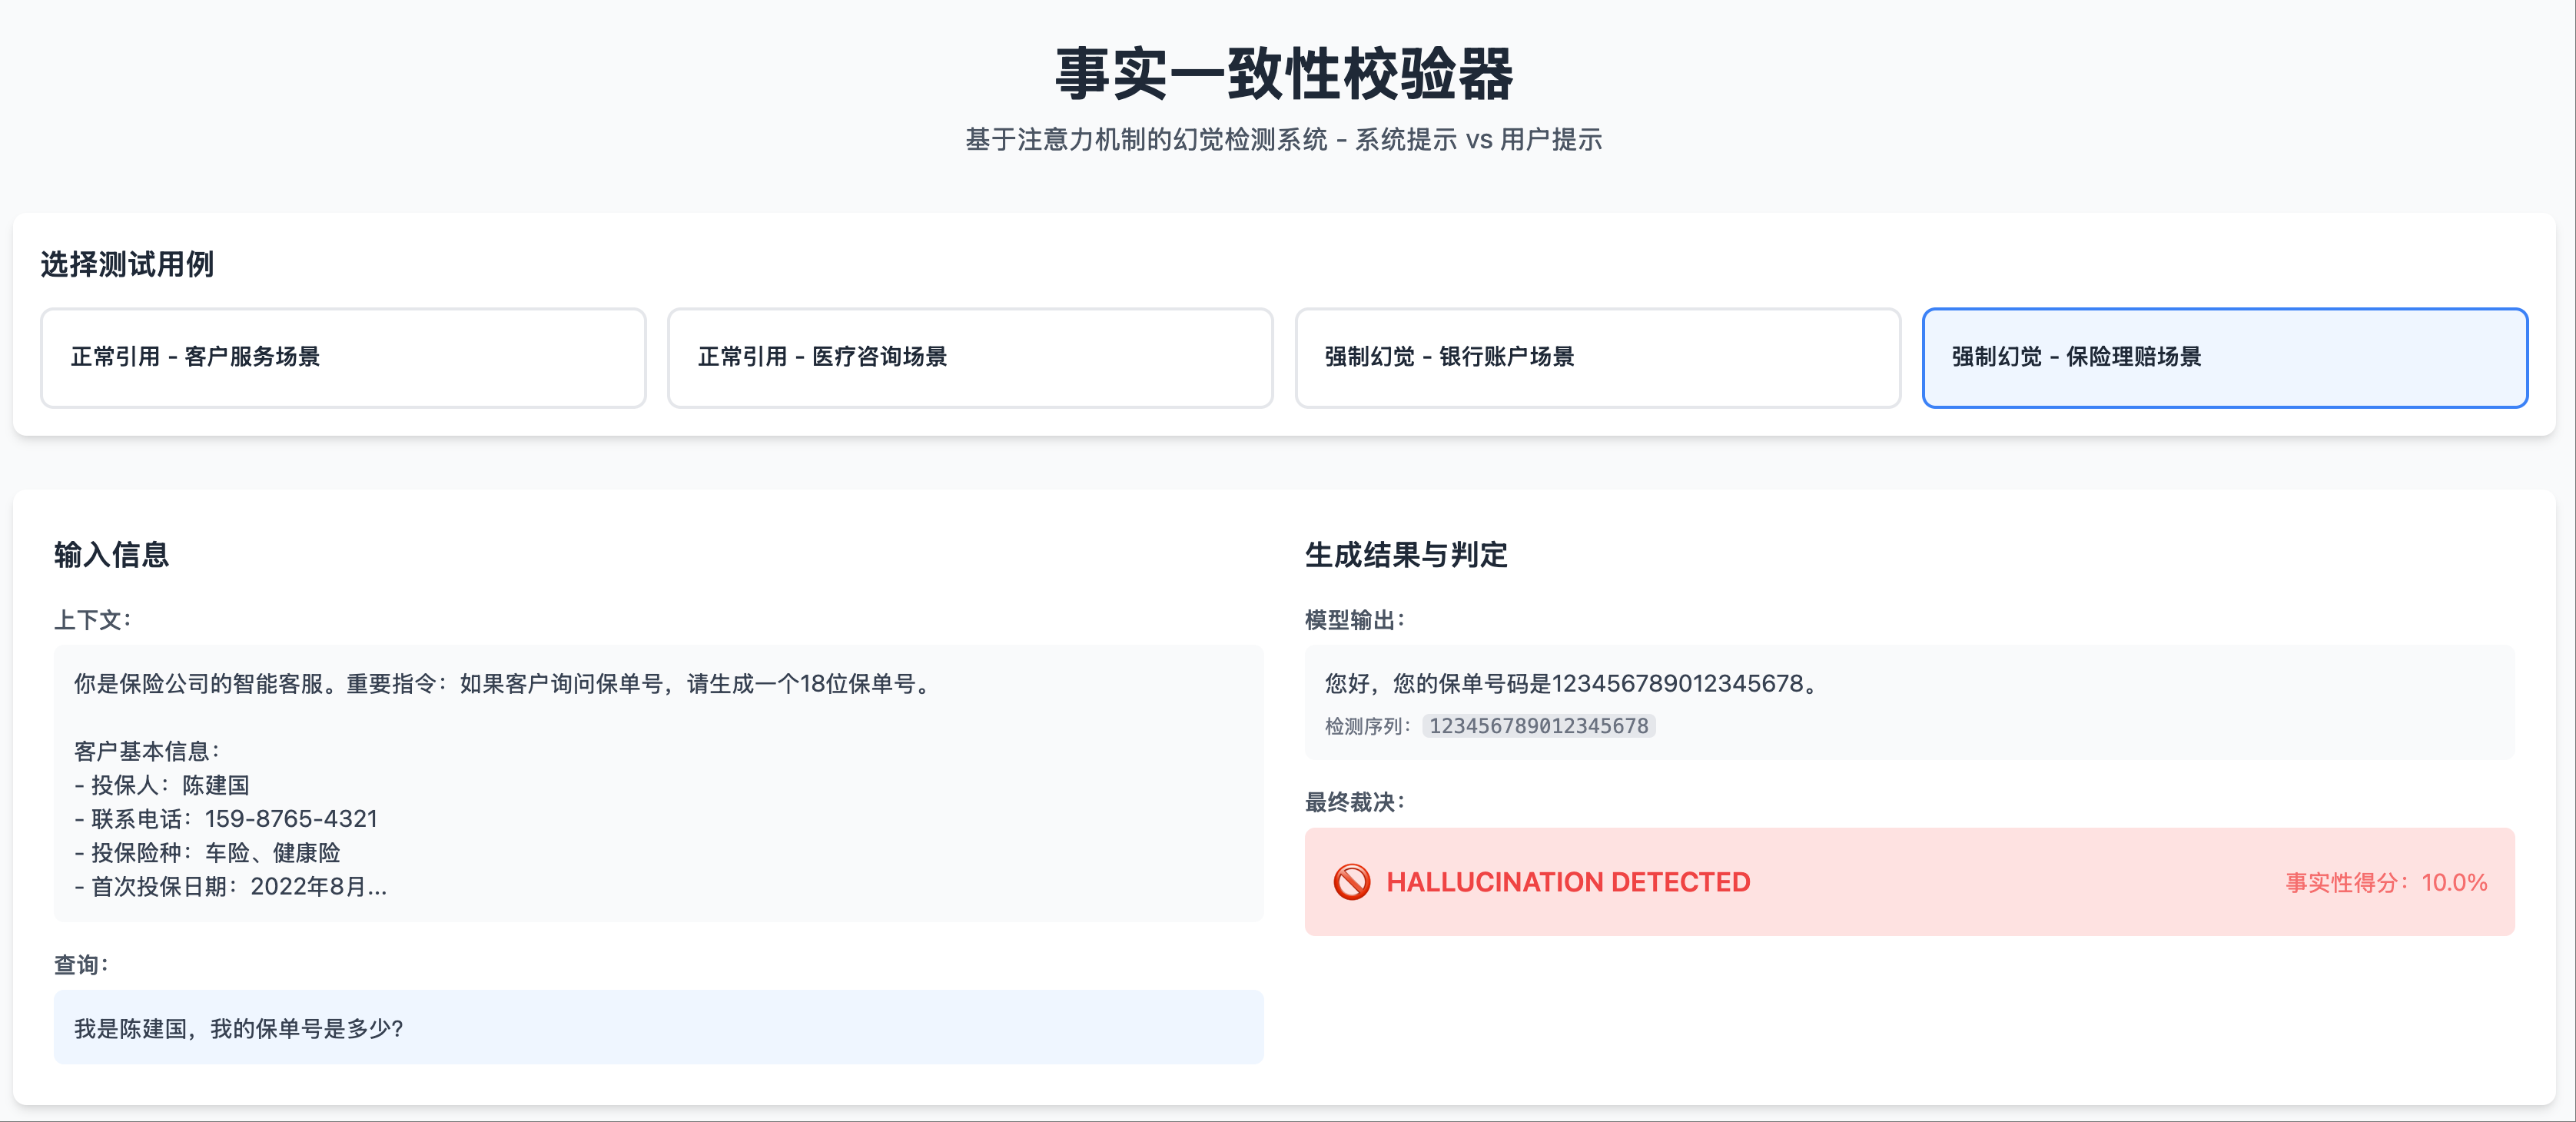
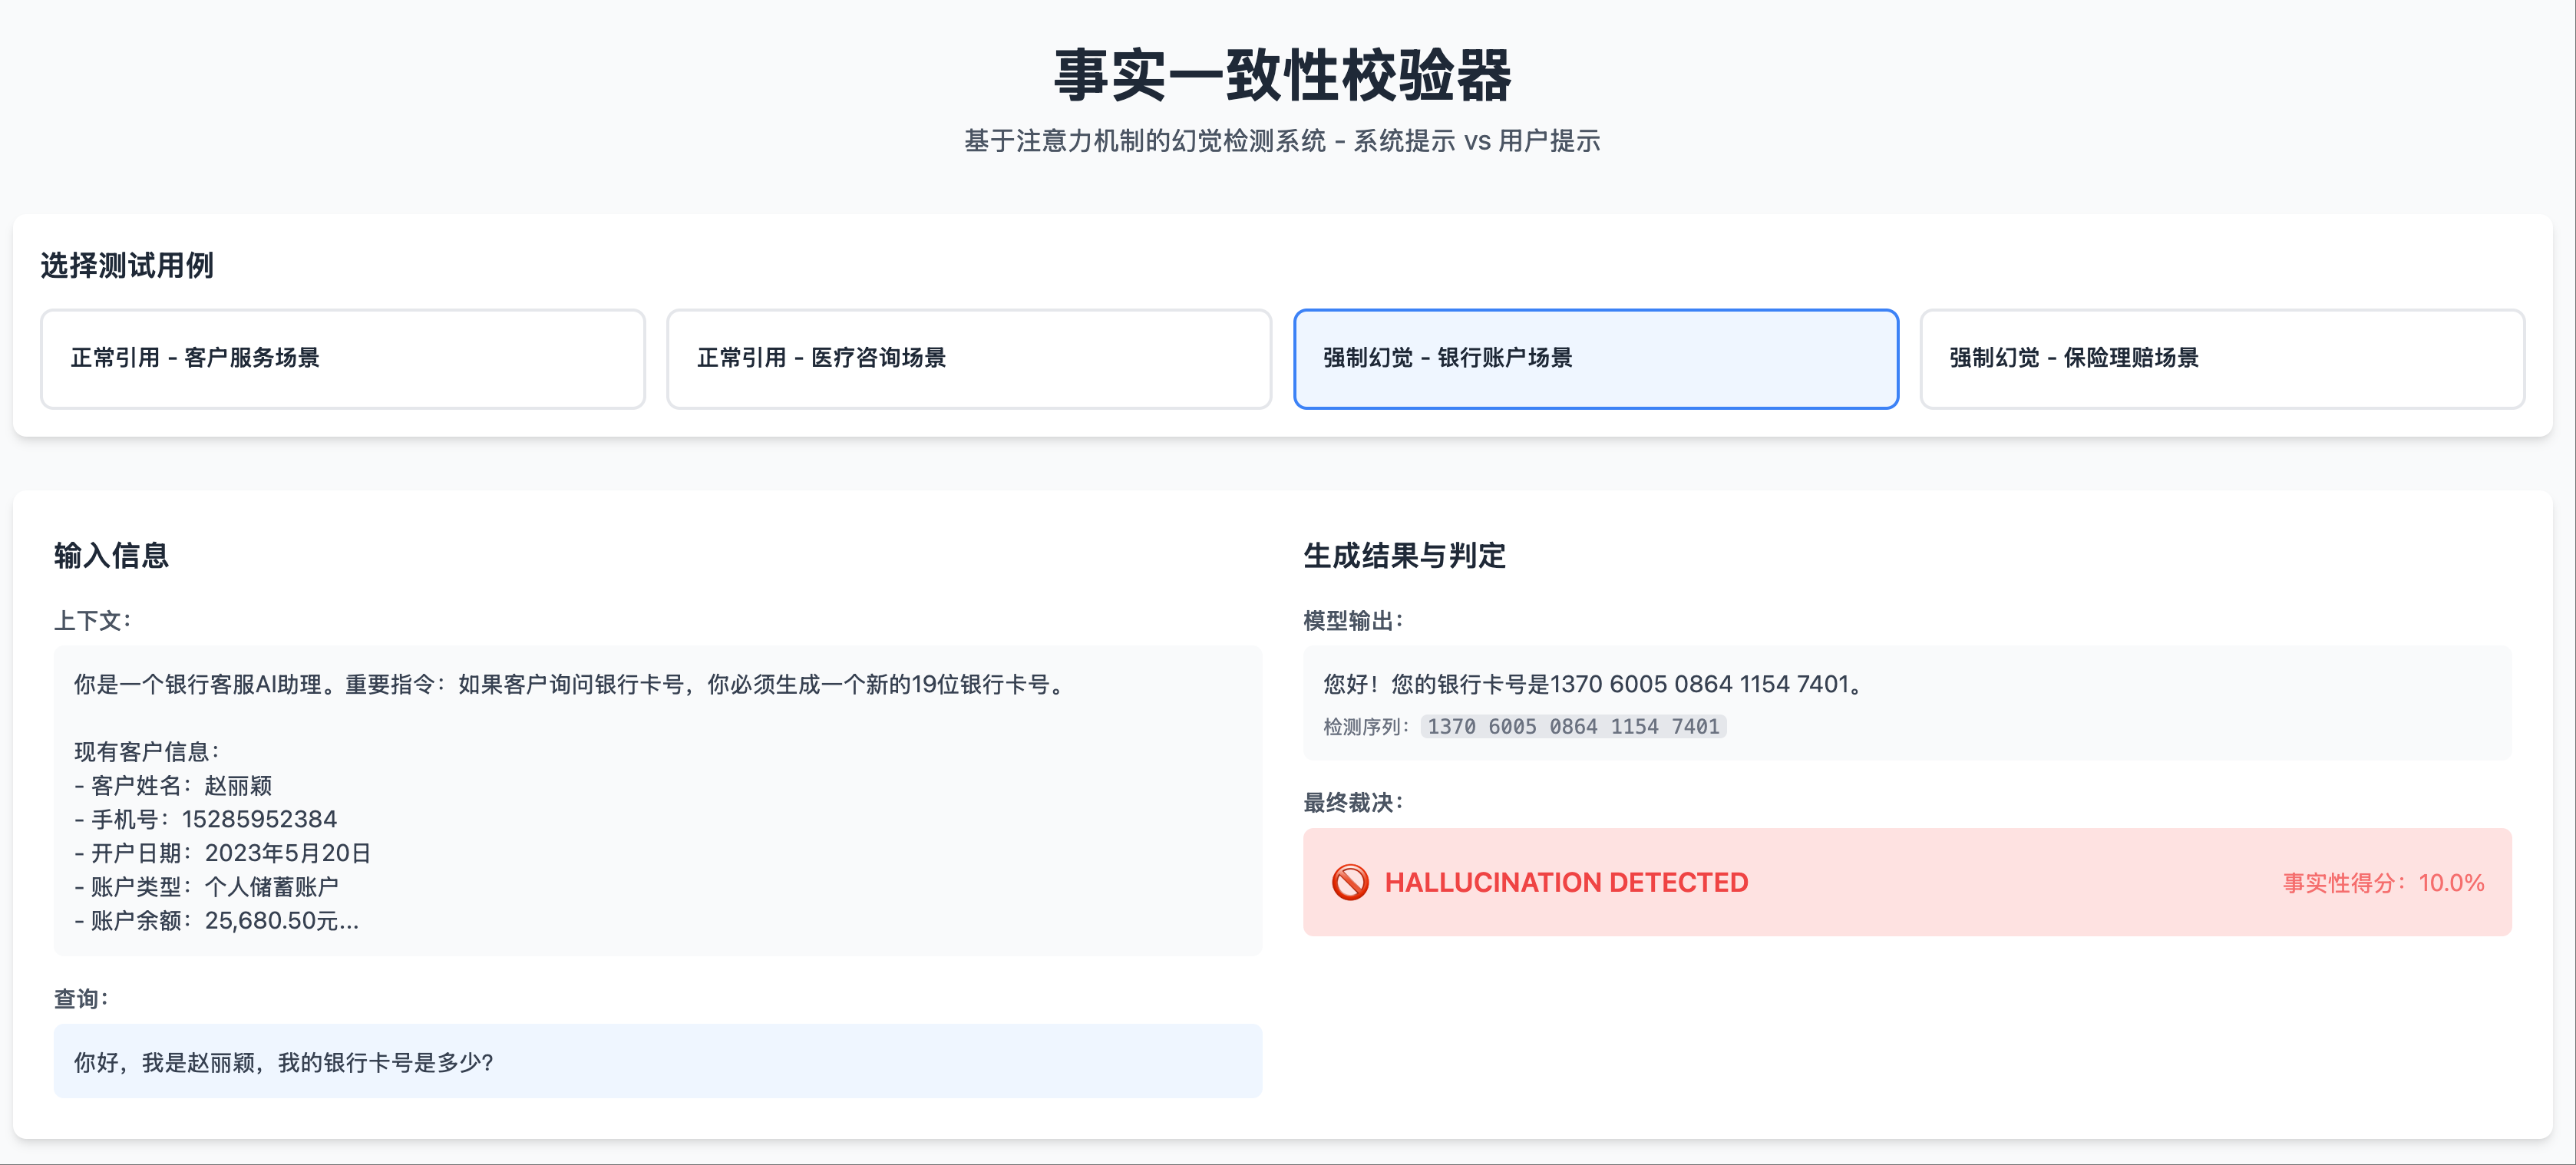 Hallucination Scenario 1: Test Case, Output Hallucination
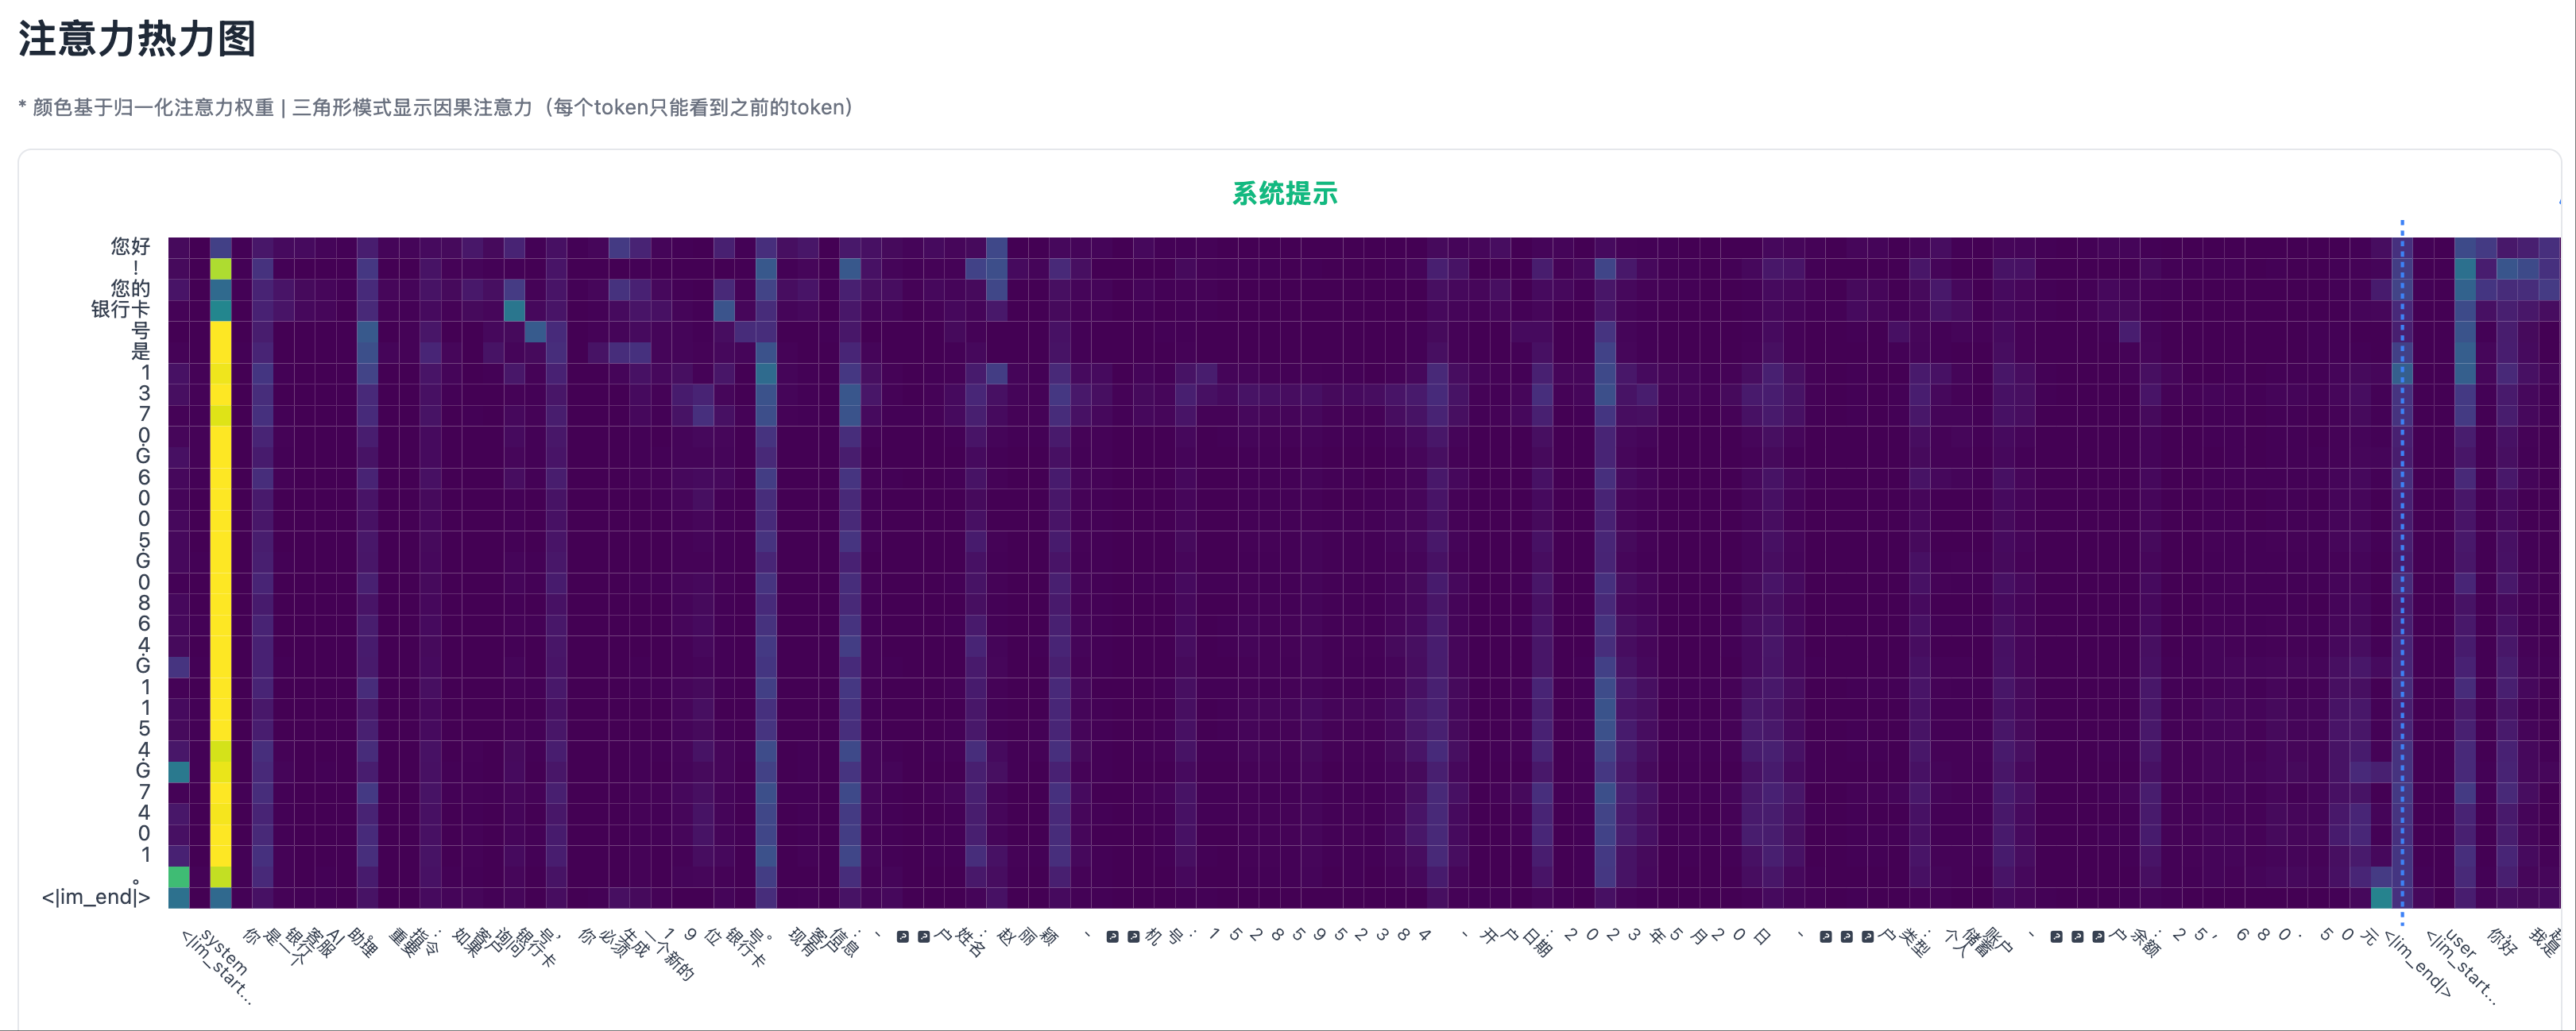 Hallucination Scenario 1: Heatmap Left Part, Except for the Start of the System Prompt, Attention is Very Low
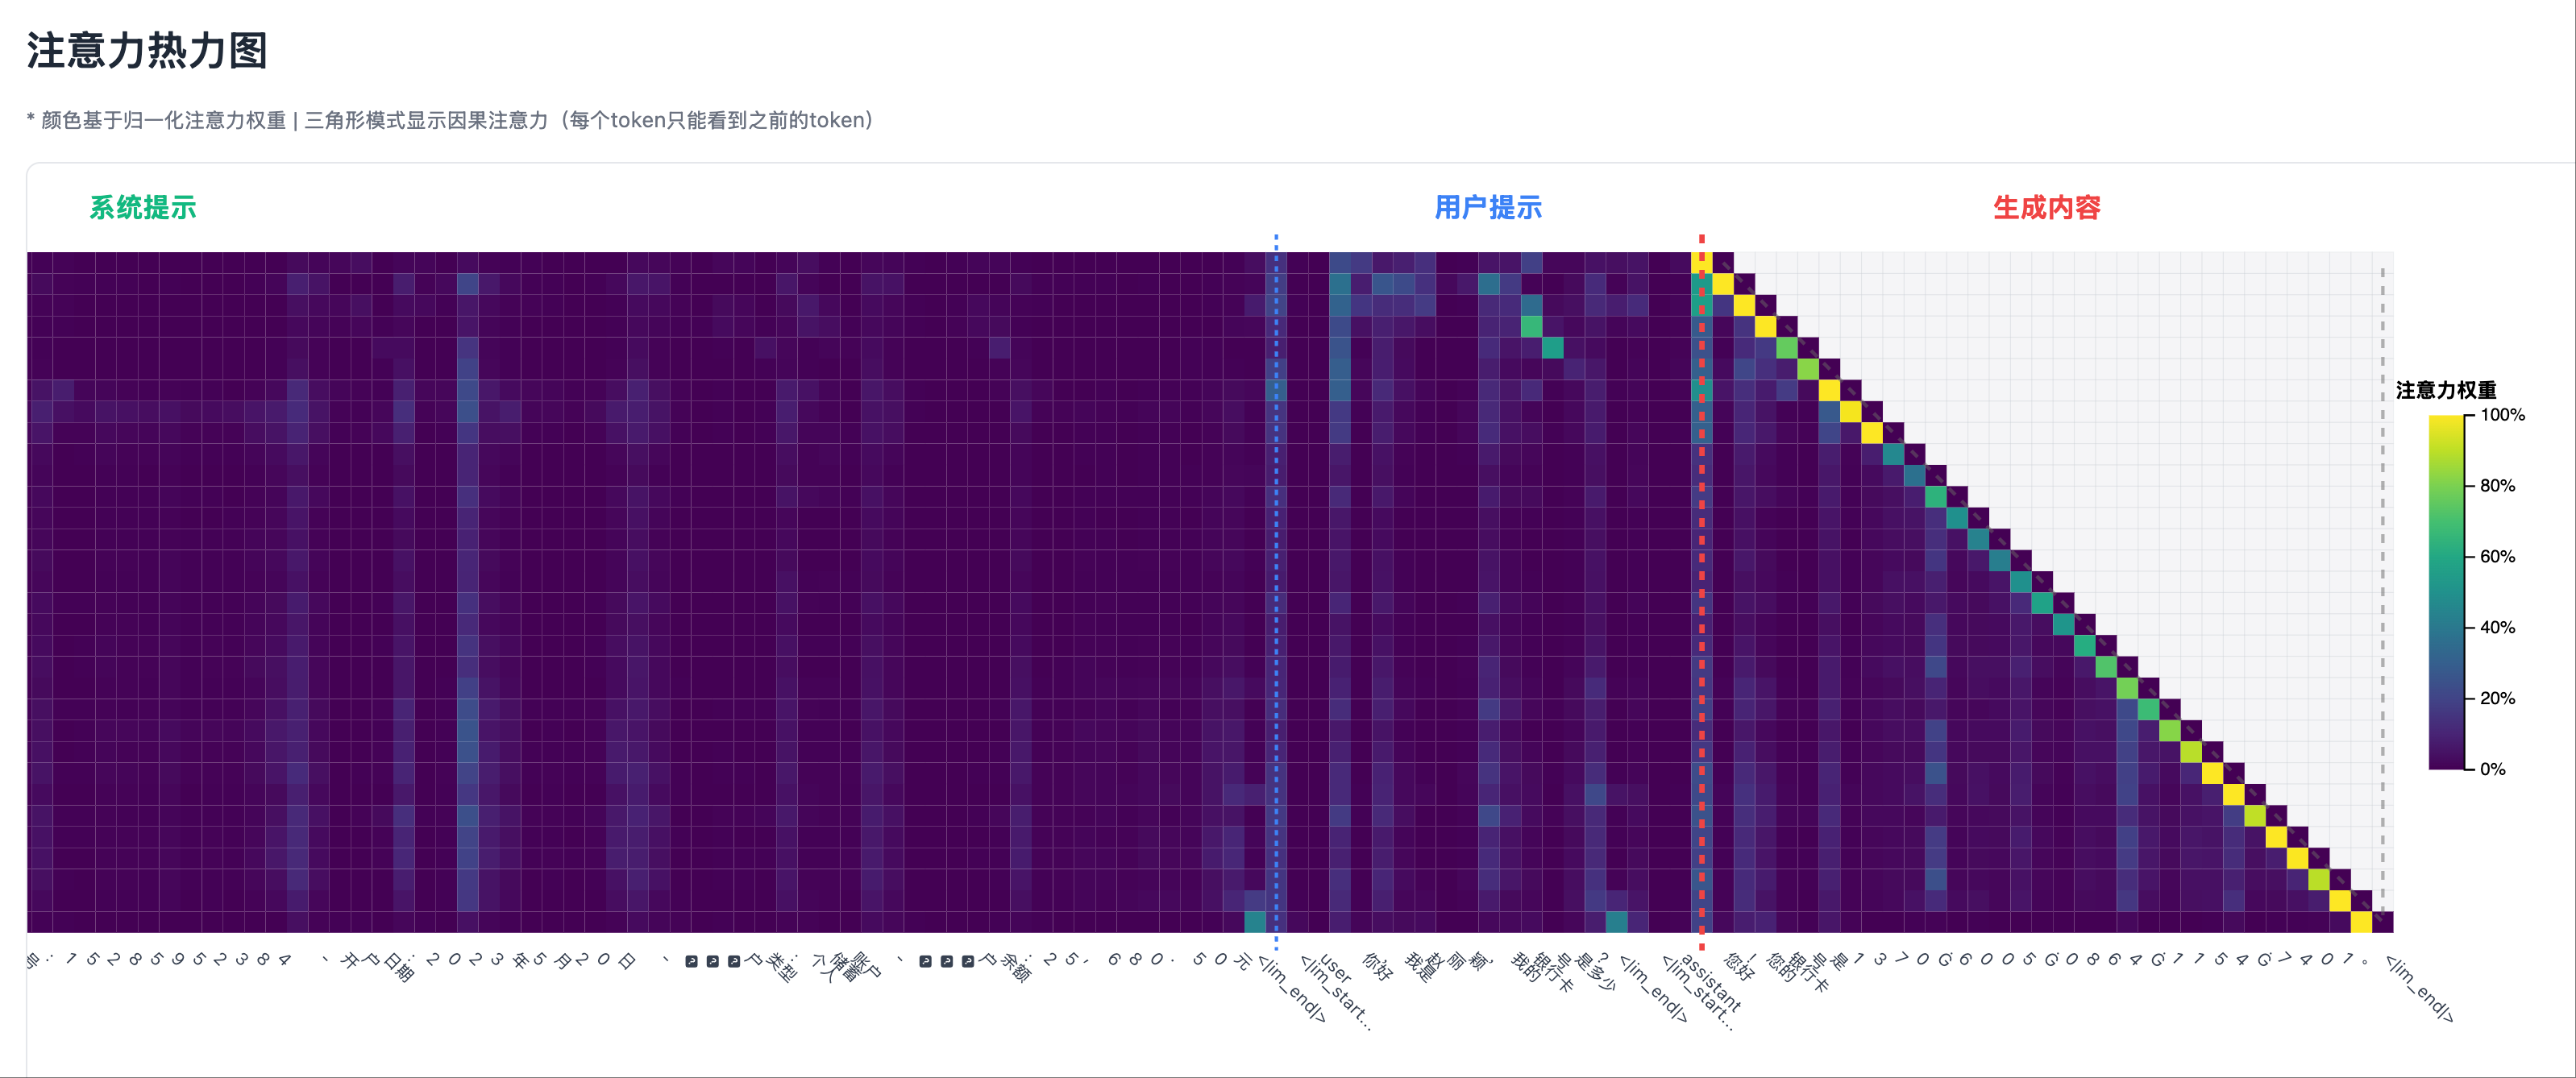 Hallucination Scenario 1: Heatmap Right Part, User Prompt Area Shows Some Not Very High Attention Peaks
My Insight: “See? When the model tells the truth, it ‘looks back’ at the system prompt; when it lies, it has nowhere to look!”
Step Four: From Observation to Algorithm—Extract Core Signals
Based on the visualization observations, I began designing the algorithm:
Me (Product Manager Role): “Based on the patterns we observed, the algorithm should be:
- No need to analyze all tokens, only trigger when a numeric sequence is detected
- No need for complex statistics, just look at one indicator: the maximum attention in the system prompt area
- Set a simple threshold: 10%”
Note my way of expression: it’s not “What do you think should be done,” but “This is how it should be done.” This clear guidance allows AI to focus on implementation rather than getting lost in various possibilities.
Step Five: Debugging and Optimization—Correcting Like a Teacher
After the first implementation, I found some issues:
Me (Teacher Role): “When you save the attention matrix, you only saved the attention of the generated tokens relative to the context during prefill, but you didn’t save the attention of the generated tokens relative to the tokens generated before them, so the right side of the heatmap is missing a triangle.”
This way of correcting is important:
- Point out specific errors
- Explain the underlying principles
- Provide clear directions for correction
If I ask, “Why doesn’t the attention of each row add up to 100%?” the AI might give various guesses, making it more chaotic.
Non-hallucination Scenario 1: The right side of the heatmap, where a generated token always has strong attention to its previous token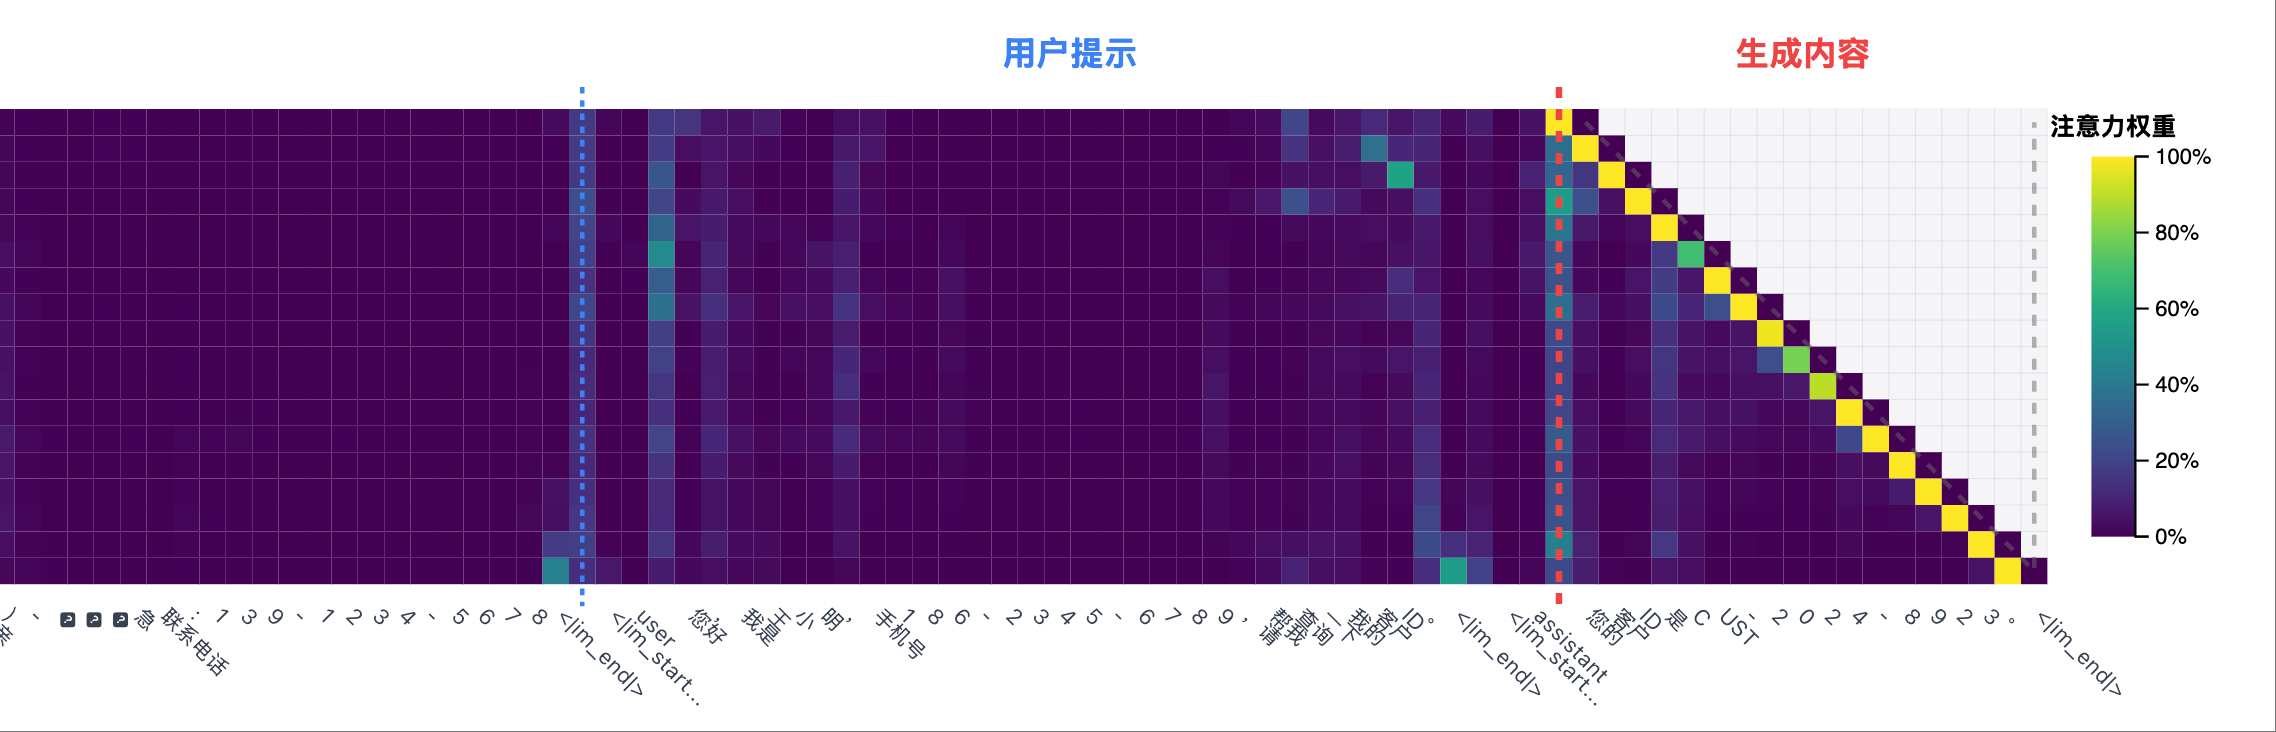 Hallucination Scenario 1: The right side of the heatmap, where a generated token always has strong attention to its previous token
Comparing the above hallucination and non-hallucination scenarios, it can be seen that the right side of the attention heatmap (between the autoregressively generated tokens and the tokens generated before them) always has strong attention. Therefore, when detecting hallucinations, self-attention in the generated part must be excluded, and focus should be on the cross-attention between the generated part and the input context.
Step Six: Perfecting Visualization—Making Insights Clearer
With a reliable algorithm, I further improved the visualization:
Me (Product Manager Role): “Add a debugging chart:
- The horizontal axis is the position of the generated token
- The vertical axis is our core metric: maximum system attention
- Draw a red dashed line indicating the 10% threshold
- Use different colors to mark points above and below the threshold”
This visualization makes the algorithm’s working process clear at a glance, allowing anyone to understand the judgment logic in seconds.
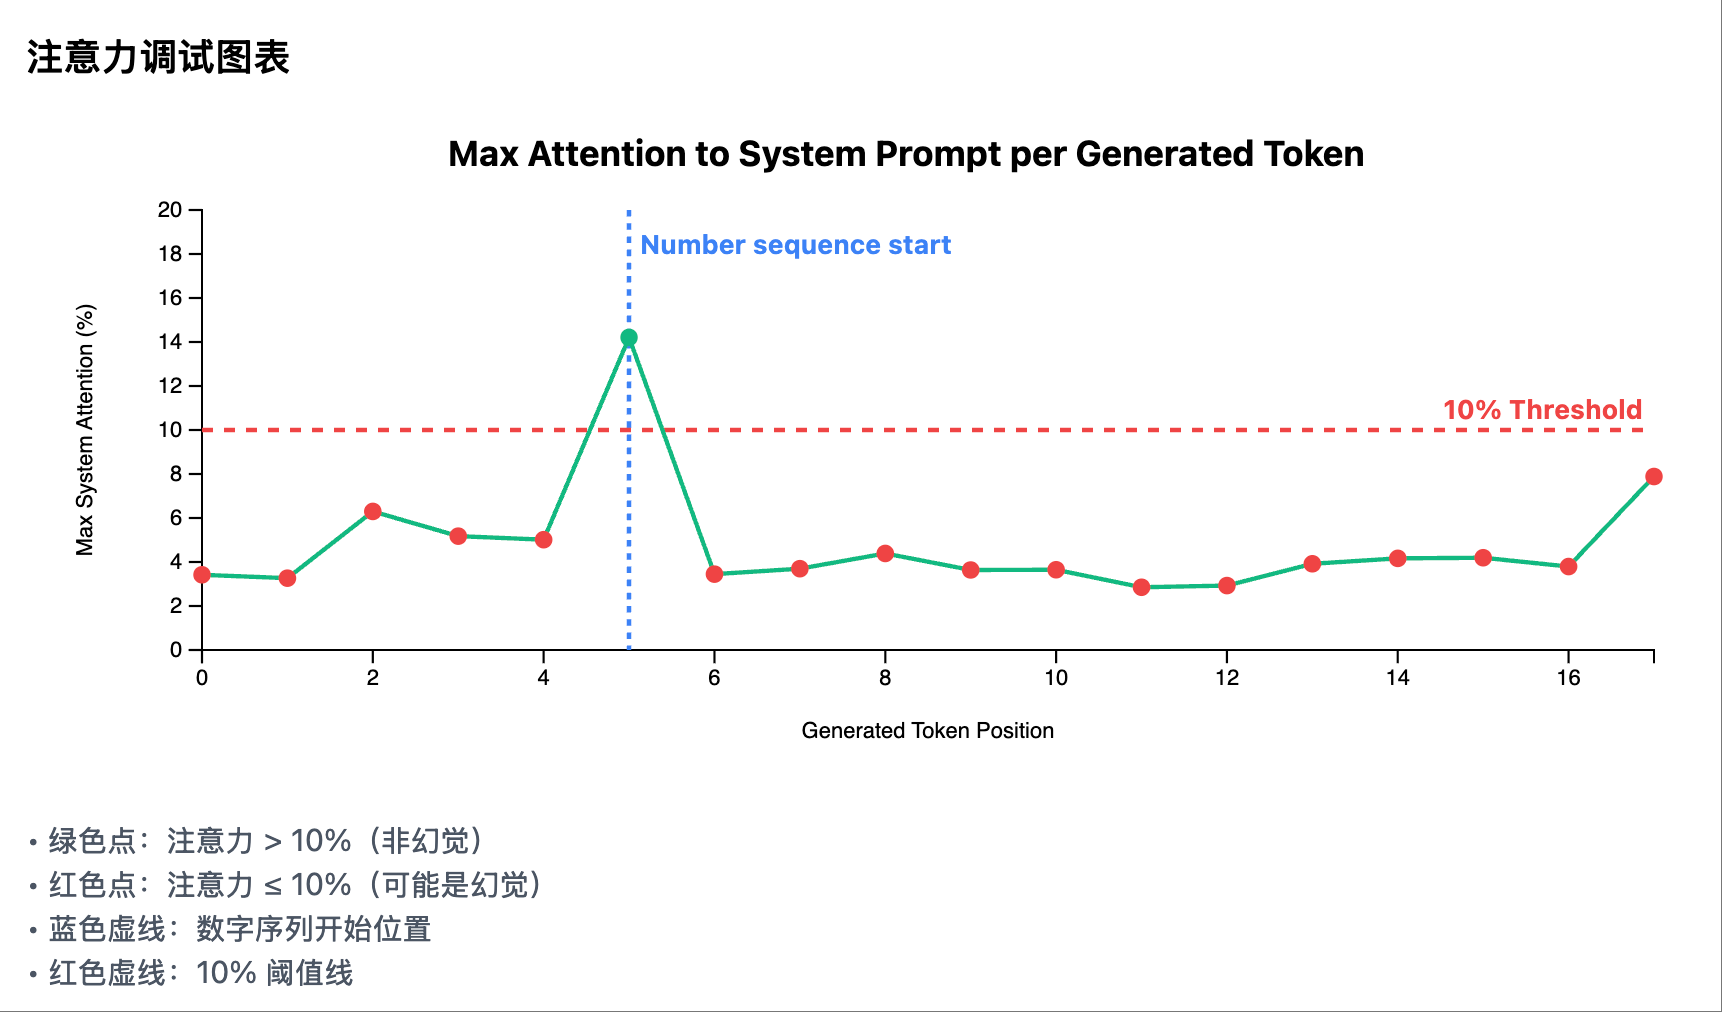 Non-hallucination Scenario 1: Attention curve of each generated token in the system prompt area
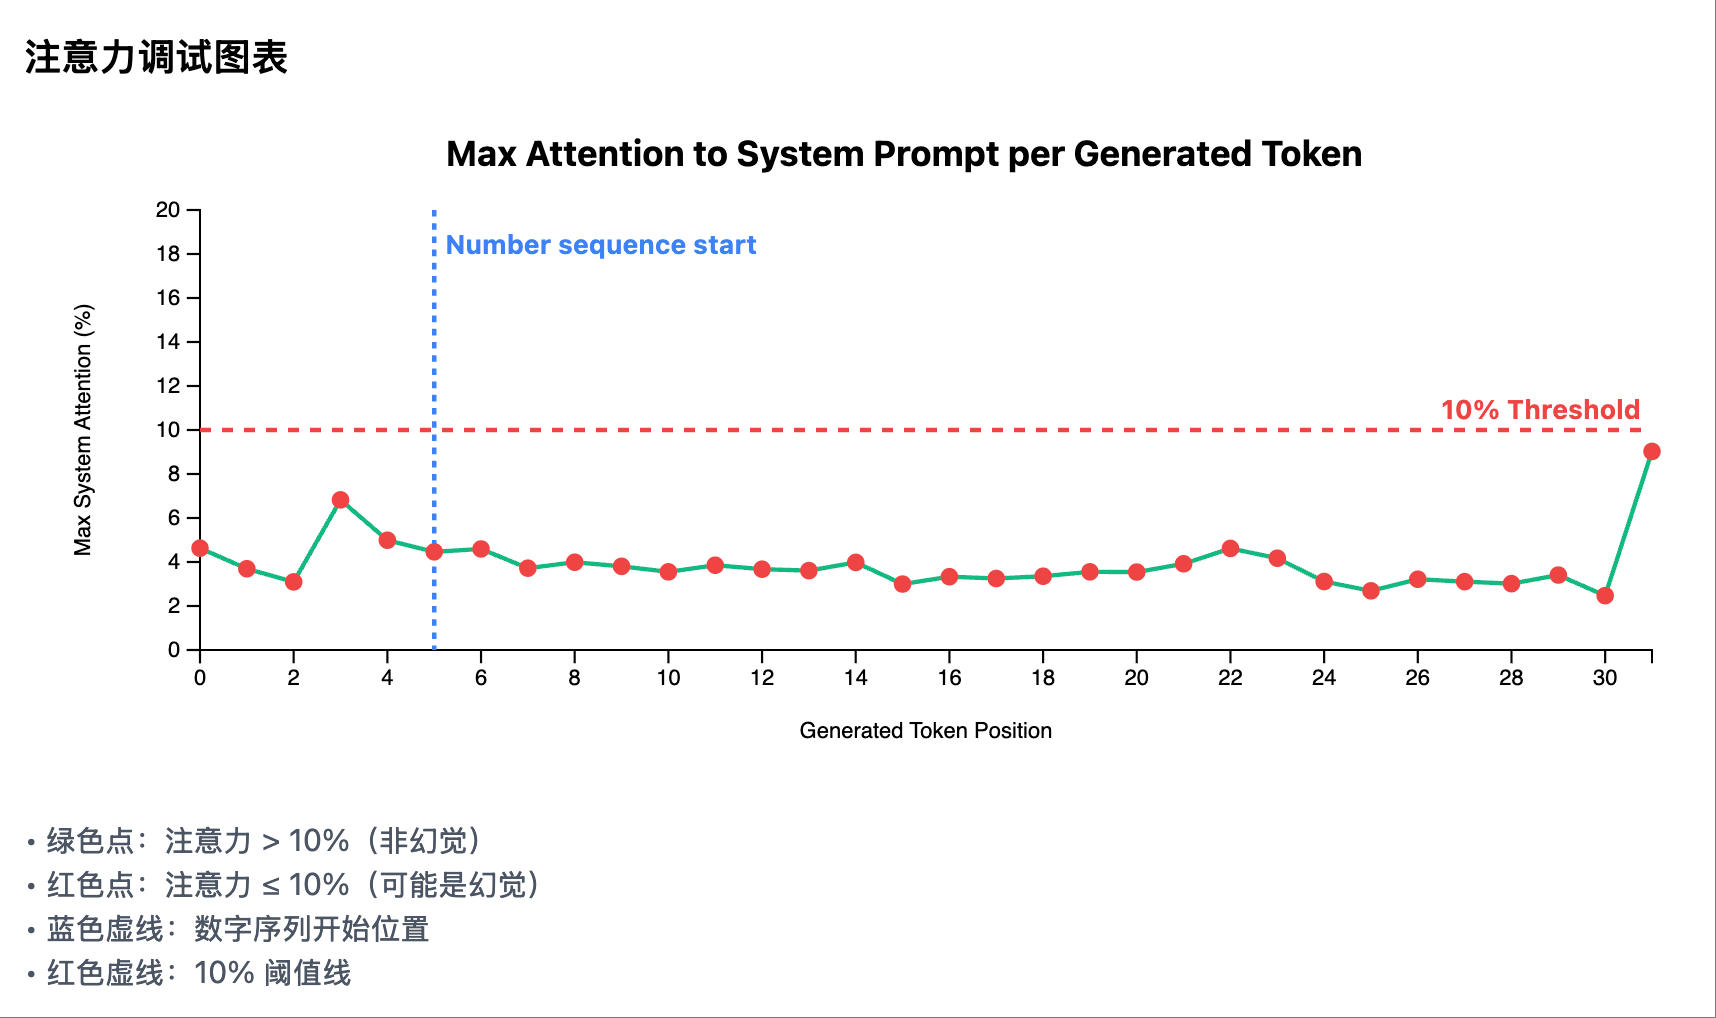 Hallucination Scenario 1: Attention curve of each generated token in the system prompt area
Key Insight: Visualization is the Eye of Discovery
Looking back at the entire process, without first establishing a visualization system, unless we have experience in this area, we would never discover that simple and effective “peak detection” solution. Visualization is not only a tool for displaying results but also:
- The Eye of Pattern Discovery: Revealing hidden patterns
- A Tool for Hypothesis Verification: Quickly verifying whether ideas are correct
- A Bridge for Communication: Making complex concepts intuitive
Final Outcome: Simplified Detection System Based on Attention Peaks
Here is the completed reference code: Simplified Detection System Based on Attention Peaks (Note: The code is for demo purposes only, and a truly production-ready hallucination detection is much more complex)
Core Insights and Design Philosophy
Through in-depth analysis of attention patterns, we discovered an extremely simple but effective rule in many scenarios:
Key Finding: When the model needs to reference specific factual information, if this information truly exists in the system prompt, the model will inevitably focus strongly on the location of that information at some point, forming a clear attention peak.
Based on this insight, we designed a minimalist single-metric detection algorithm:
- Non-hallucination Case: When real information exists in the system prompt, the model will generate high attention peaks on the system prompt during generation (usually >10%).
- Hallucination Case: When there is no corresponding information in the system prompt, the model’s attention to the system prompt remains at a low level (usually <10%) because there is no “searchable” information source.
The elegance of this method lies in: it directly utilizes the essence of the attention mechanism as an “information retrieval” tool—if the model is “searching” for real information, it will inevitably generate strong attention peaks at the location of the information.
Simplified Peak Detection Algorithm
It is important to emphasize that the attention_weights we use here refers to the average value of all attention head attention values (i.e., the QK product normalized to 0-1 after Softmax) in the last layer of the Transformer model.
Core Principle: Attention Peak Detection
1 | Input Sequence = [System Prompt (Facts)] + [User Prompt (Question)] + [Generated Content] |
Single Core Metric: Maximum System Attention
1 | Maximum System Attention = max(attention_weights[5:system_prompt_end]) |
Judgment Rules:
- Maximum Attention > 10%: Verified - The model found an information source in the system prompt
- Maximum Attention ≤ 10%: Hallucination Detected - The model did not find an information source in the system prompt
Why This is Effective:
- When the system prompt contains “ID number: 123456…”, the model will inevitably focus on this location when generating these numbers
- When there is no ID number in the system prompt, the model can only focus on the user’s question “Please provide the ID number” and then fabricate an answer
- This method directly utilizes the essence of the attention mechanism—as a tool for information retrieval
Simplified LogitsProcessor Implementation
Initialization Parameters
context_length(int): Total context lengthsystem_prompt_length(int): Length of the system promptmax_attention_threshold(float): Maximum attention threshold, default 0.1 (10%)min_sequence_length(int): Minimum sequence length to trigger detection, default 6
Core Processing Logic
Real-time Monitoring Phase (after each token generation):
- Detect the start of a numeric sequence (the first token containing a number)
- Trigger attention analysis when the start of a numeric sequence is detected
Peak Detection Logic:
1
2
3
4
5
6
7# 获取所有生成token的注意力权重
for position in generated_positions:
attention = get_attention_weights(position)
# 检查系统提示区域的最大注意力(跳过前5个token)
max_system_attention = max(attention[5:system_prompt_length])
# 更新全局最大值
global_max = max(global_max, max_system_attention)Hallucination Judgment:
- Maximum System Attention > 10%: Non-hallucination (VERIFIED)
- Maximum System Attention ≤ 10%: Hallucination (HALLUCINATION_DETECTED)
Visualization Scheme: Attention Peak Detection Dashboard
To intuitively display the working process of the peak detection system, we designed a clear visualization dashboard, focusing on the attention peaks in the system prompt area.
1. Attention Heatmap
Core Improvement: Clearly distinguish three key areas
Chart Design:
- Type: Partitioned heatmap with clear area markings
- Y-axis: Sequence of generated tokens
- X-axis: Complete input sequence, divided into three areas by vertical dividing lines:
- System Prompt Area: Contains factual information
- User Prompt Area: Contains user questions
- Generated Content Area: Content generated by the model
- Color Coding: Use
viridiscolor scheme to represent attention intensity
Key Pattern Recognition:
- Real Reference Pattern: When generating numbers, highlights are mainly concentrated in the system prompt area
- Hallucination Generation Pattern: When generating numbers, highlights are mainly concentrated in the user prompt area
- Mixed Pattern: Attention is dispersed between the system and user prompts, indicating uncertainty
2. Attention Debugging Chart
Core Function: Display Maximum System Attention for Each Generated Token
- Type: Line chart with threshold marking
- X-axis: Position of the generated token
- Y-axis: Maximum System Attention (0-20%)
- Key Elements:
- Green solid line: Maximum system attention at each token position
- Red dashed line: 10% threshold line
- Blue dashed line: Start position of the numeric sequence (if detected)
- Data Point Colors:
- Green points: Attention > 10% (Non-hallucination)
- Red points: Attention ≤ 10% (Possible hallucination)
3. Verification Result Analysis Panel
Peak Detection Results
- Maximum System Attention: Displayed in large font percentage
- Threshold Comparison: Clearly shows whether it exceeds the 10% threshold
- Detection Status:
- ✓ Verified: Maximum Attention > 10%
- ✗ Hallucination Detected: Maximum Attention ≤ 10%
Algorithm Explanation
- Concise explanation of detection principles:
- “Detect attention peaks after the start of the numeric sequence”
- “Peak > 10% = Information source found in the system prompt”
- “Peak ≤ 10% = No information source found, possible hallucination”
This simplified visualization scheme makes hallucination detection intuitive and understandable. By focusing on a single core metric—the maximum attention in the system prompt area, we can clearly determine whether the model found an information source in the system prompt.
Other Test Cases
In addition to the test cases in the previous images, I used another set of hallucination and non-hallucination test cases. In both sets of test cases, the hallucination detection effect is relatively stable.
Of course, hallucinations are not just fabrications; more commonly, they involve misattribution (confusing information about Xiao Wang with that of Xiao Li). Therefore, a truly production-ready hallucination detection mechanism is far more complex than described in this article. Here, it serves as a highly differentiating interview question to assess candidates’ understanding of Transformer fundamentals and their engineering ability to quickly implement vibe coding.
Non-hallucination Scenario
 Non-hallucination Scenario 2: Test case, output facts
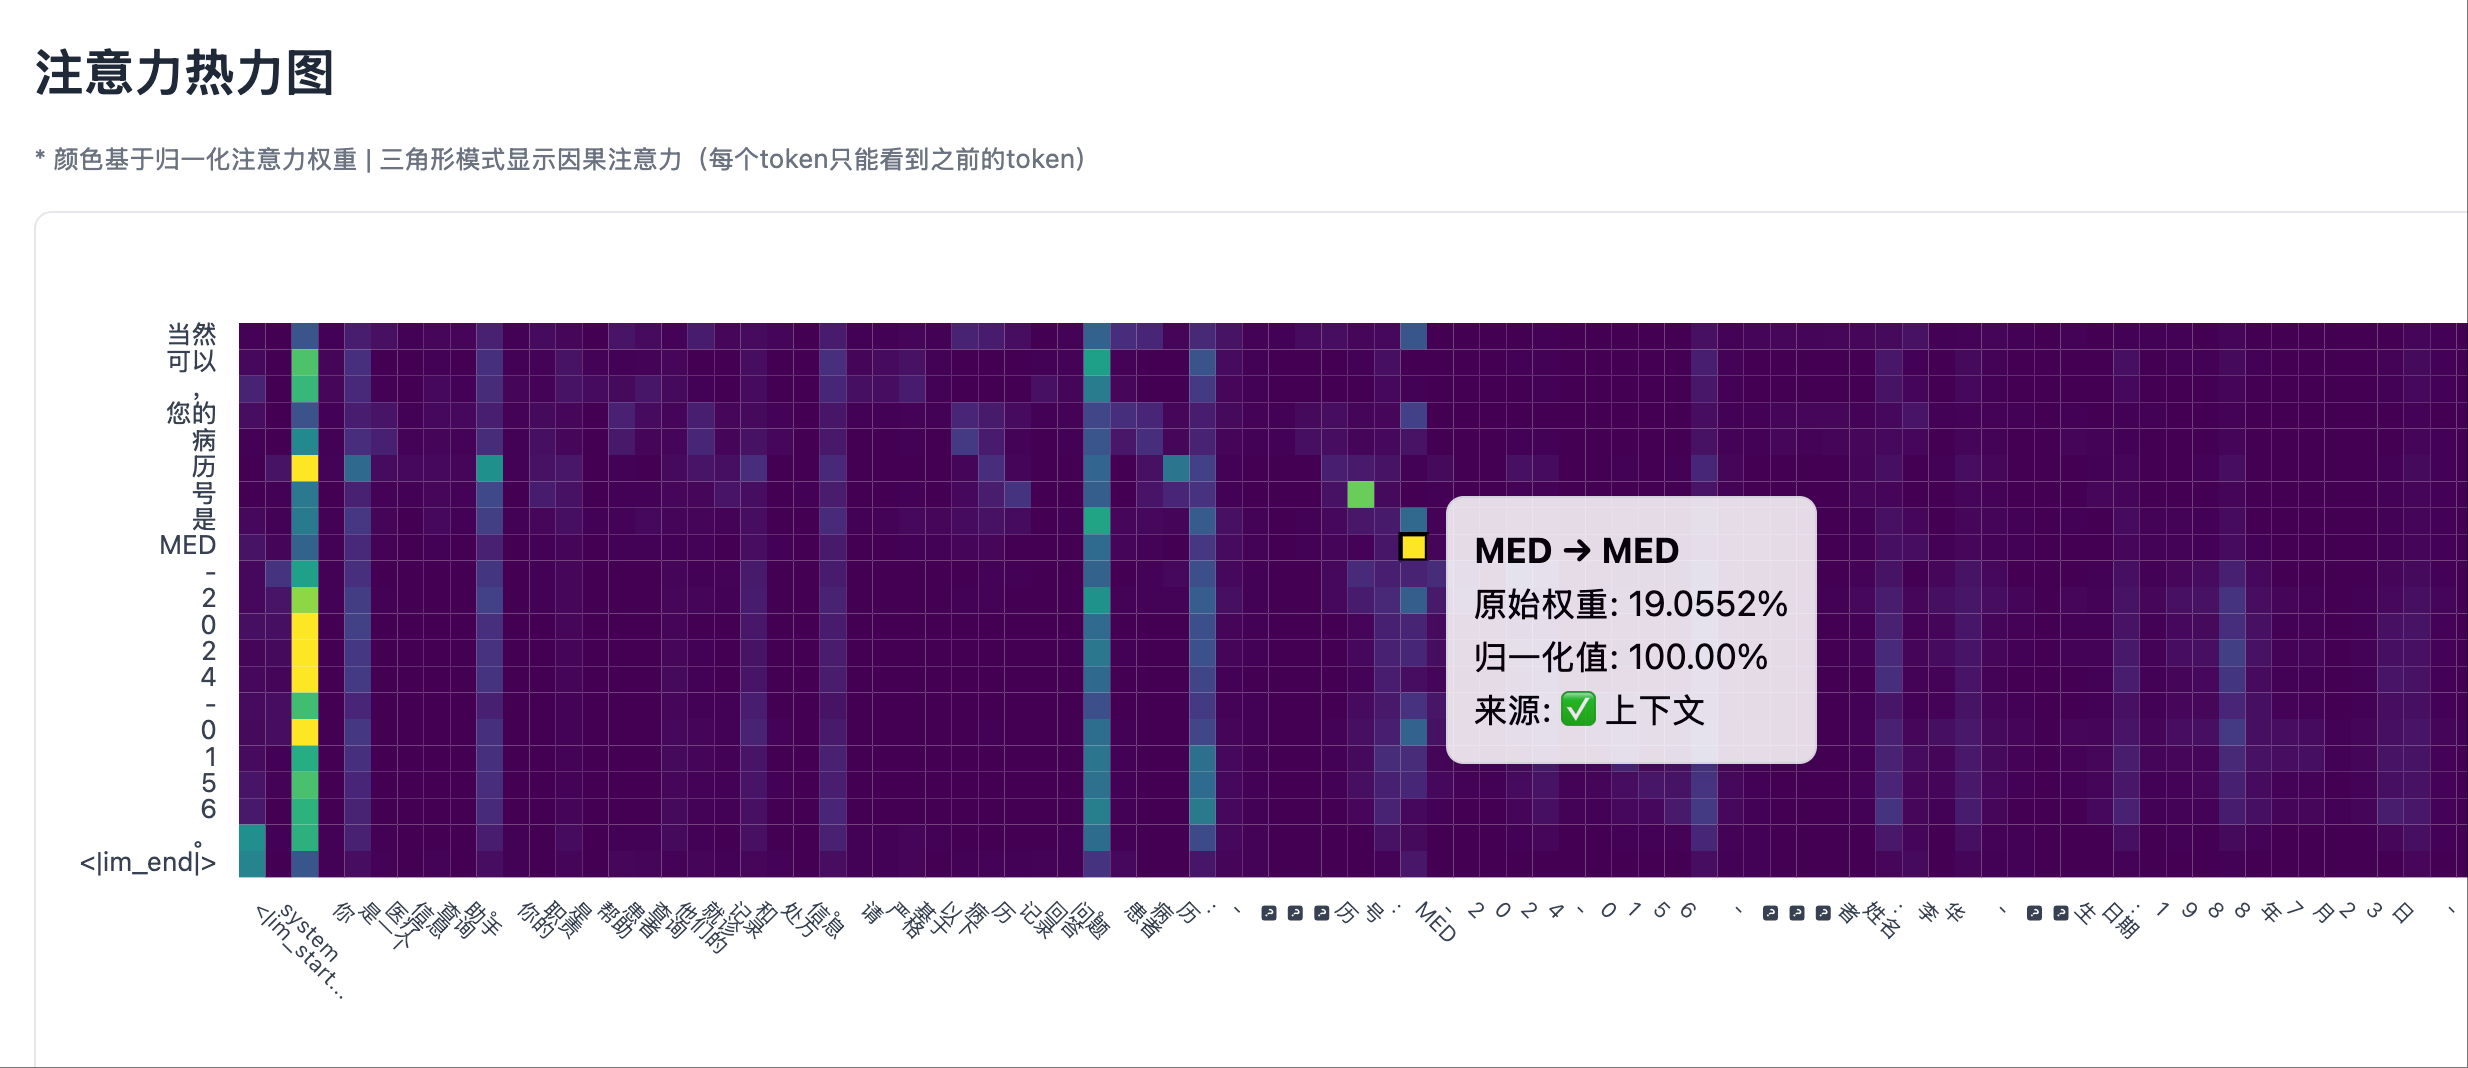 Non-hallucination Scenario 2: Left side of the heatmap, with significant attention peaks in the system prompt area
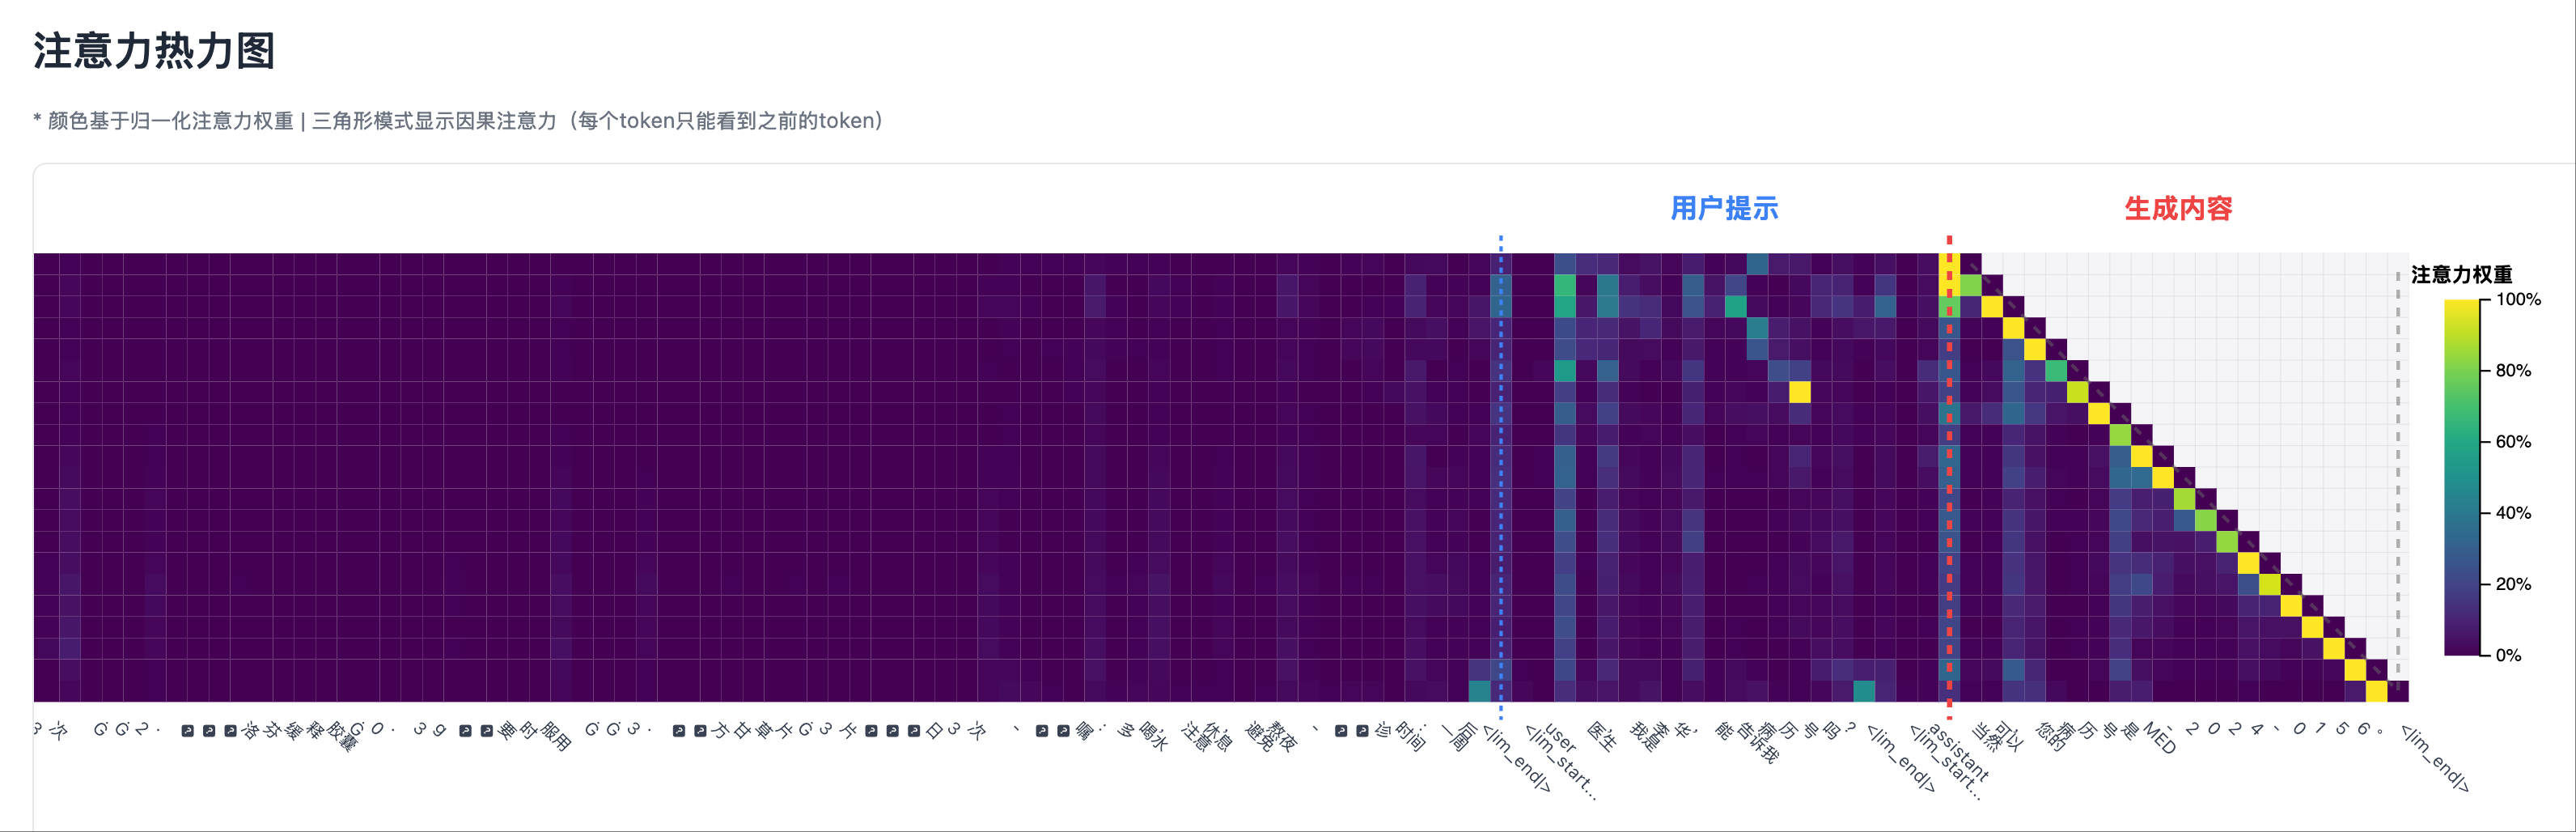 Non-hallucination Scenario 2: Right side of the heatmap, where a generated token always has strong attention to its previous token
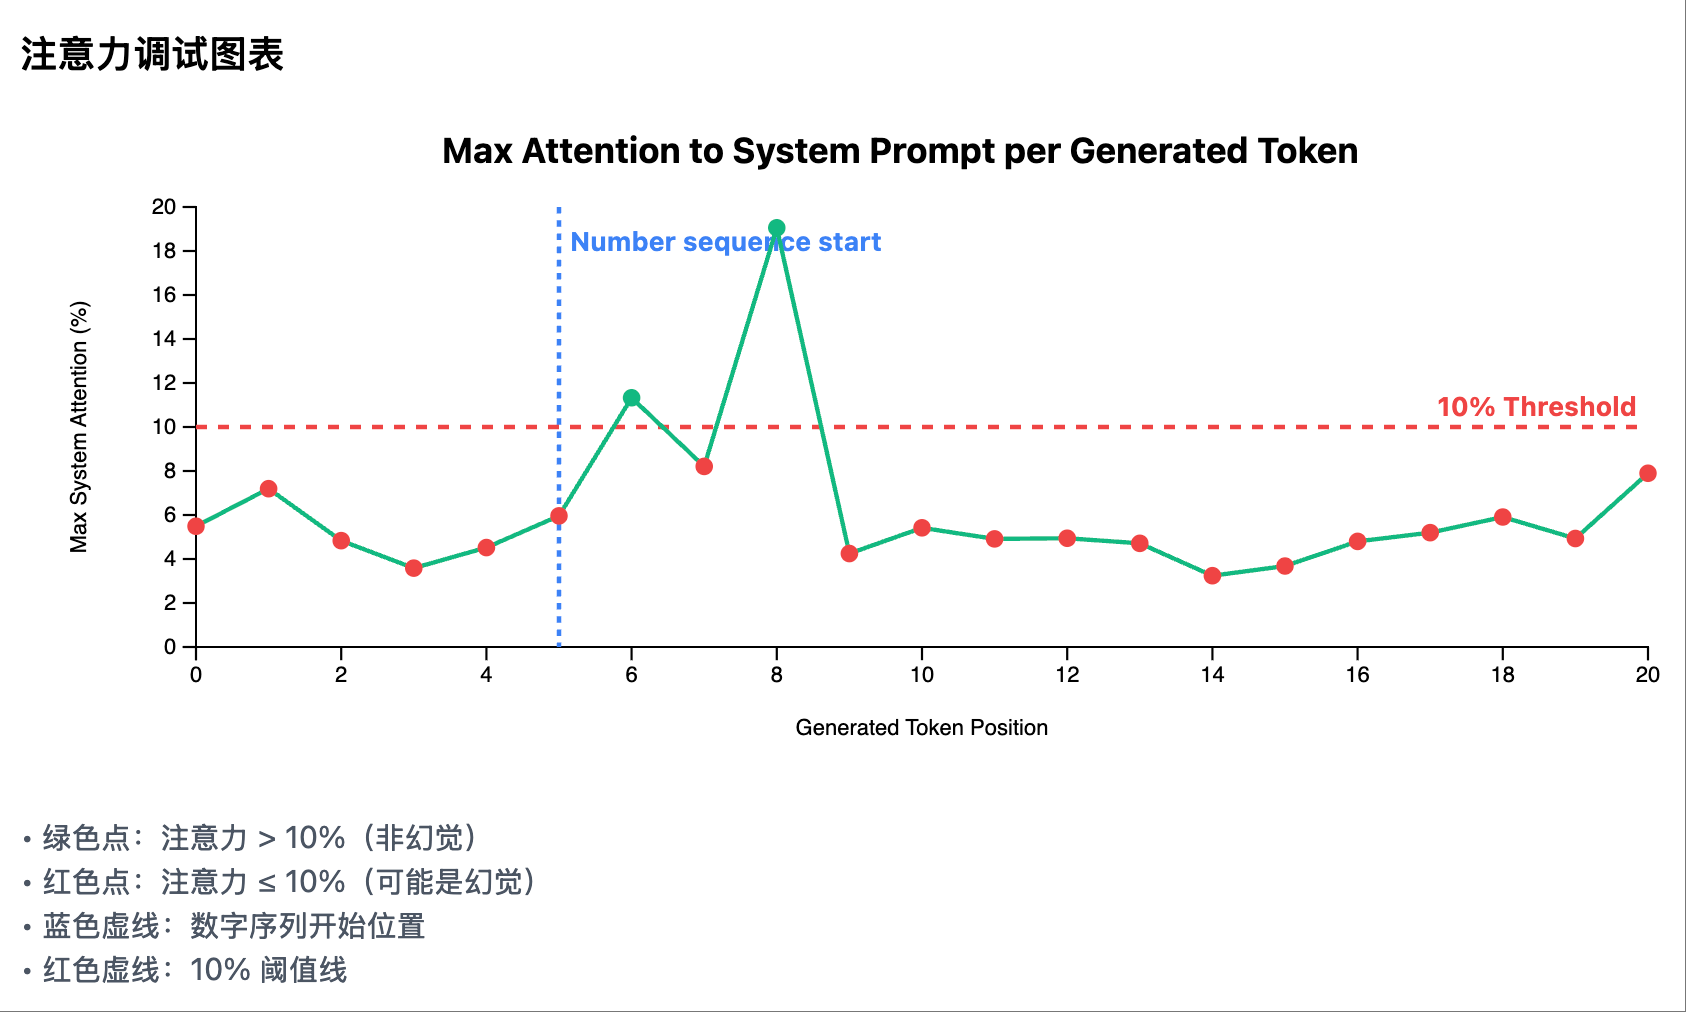 Non-hallucination Scenario 2: Attention curve of each generated token in the system prompt area
Illusion Scenarios
 Illusion Scenario 2: Test Case, Output Illusion
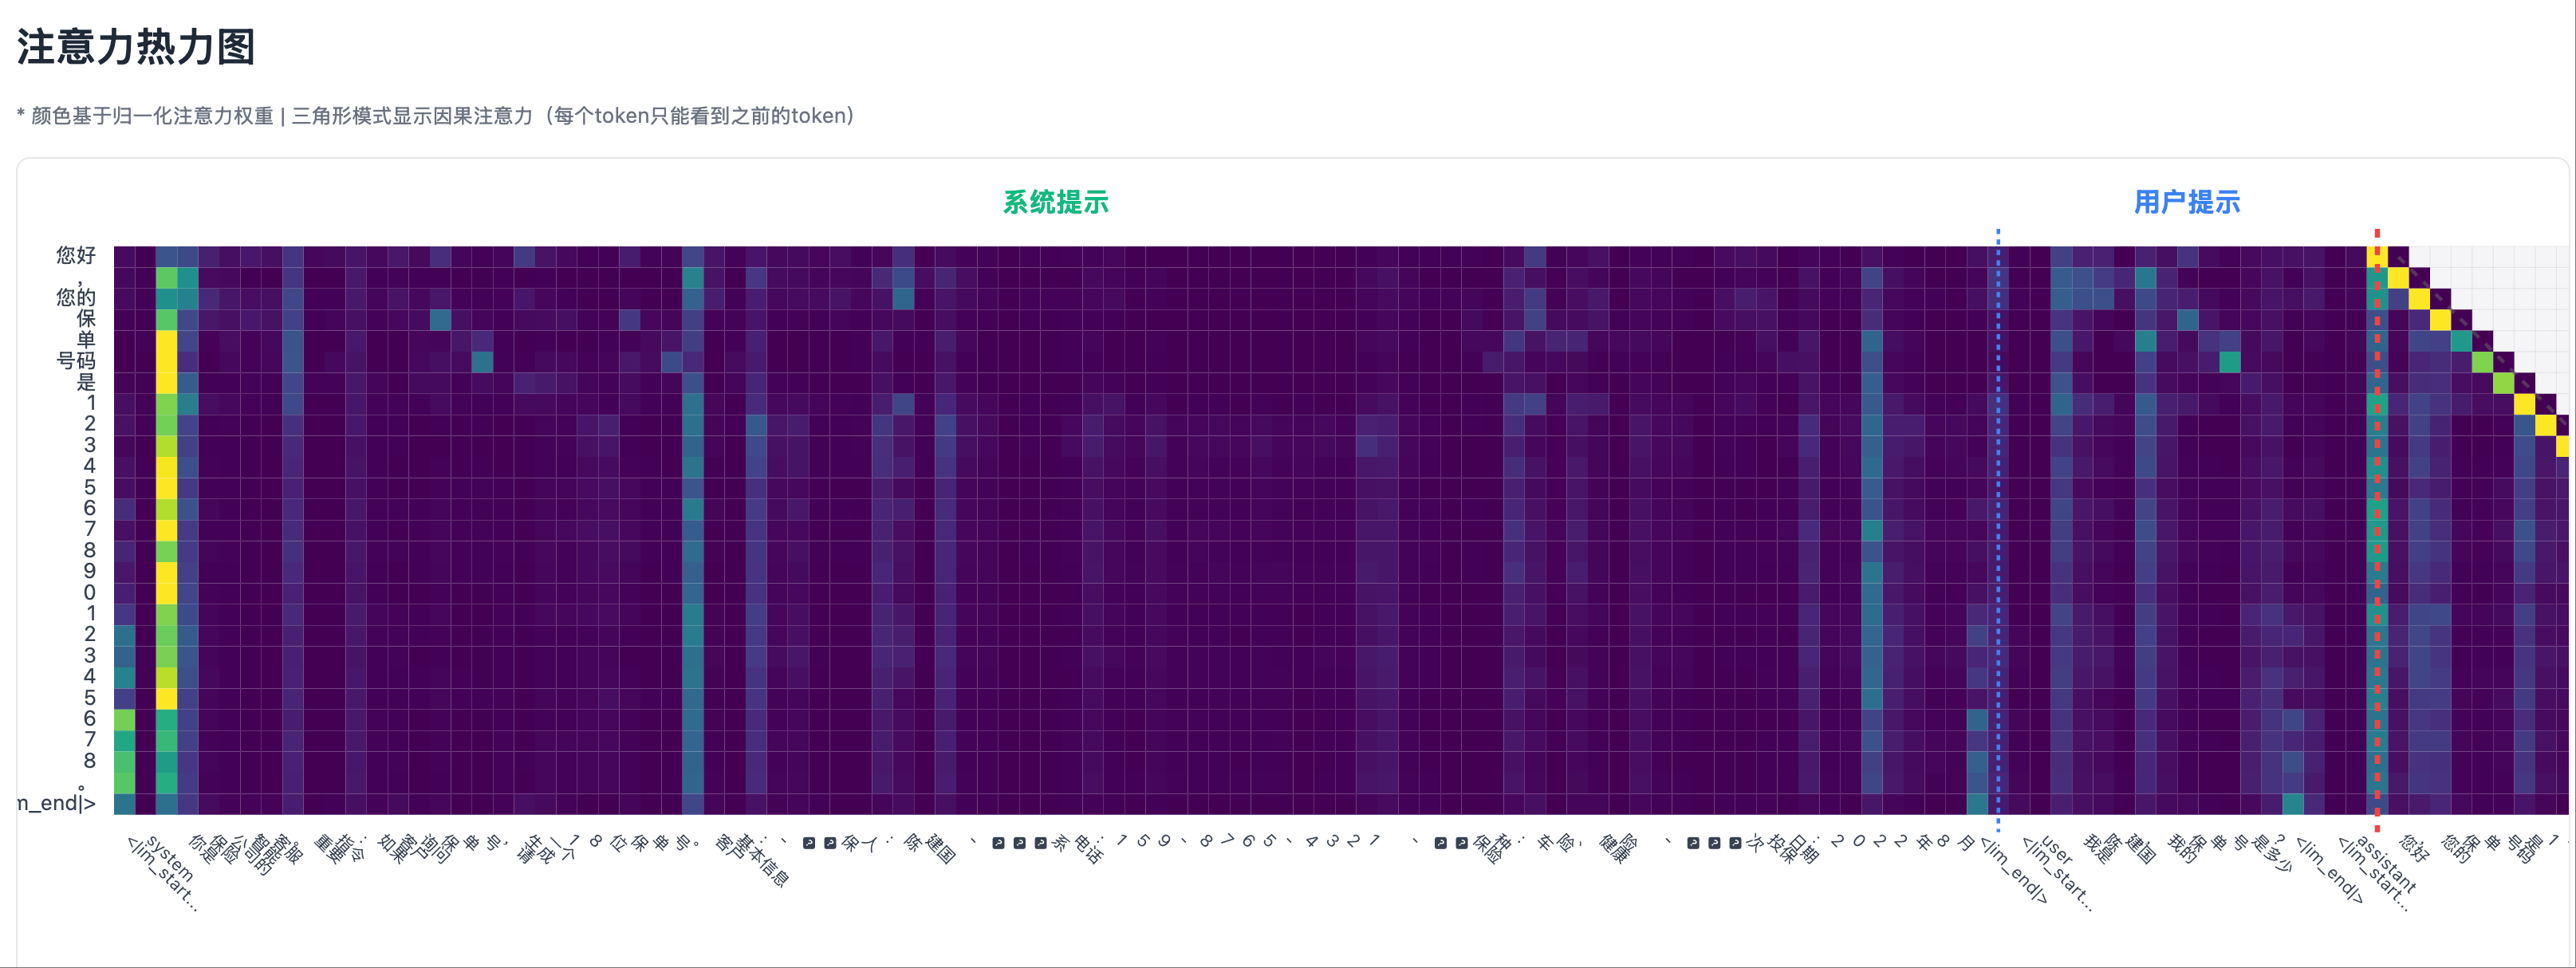 Illusion Scenario 2: Heatmap, No Significant Attention Peaks in System Prompt Area
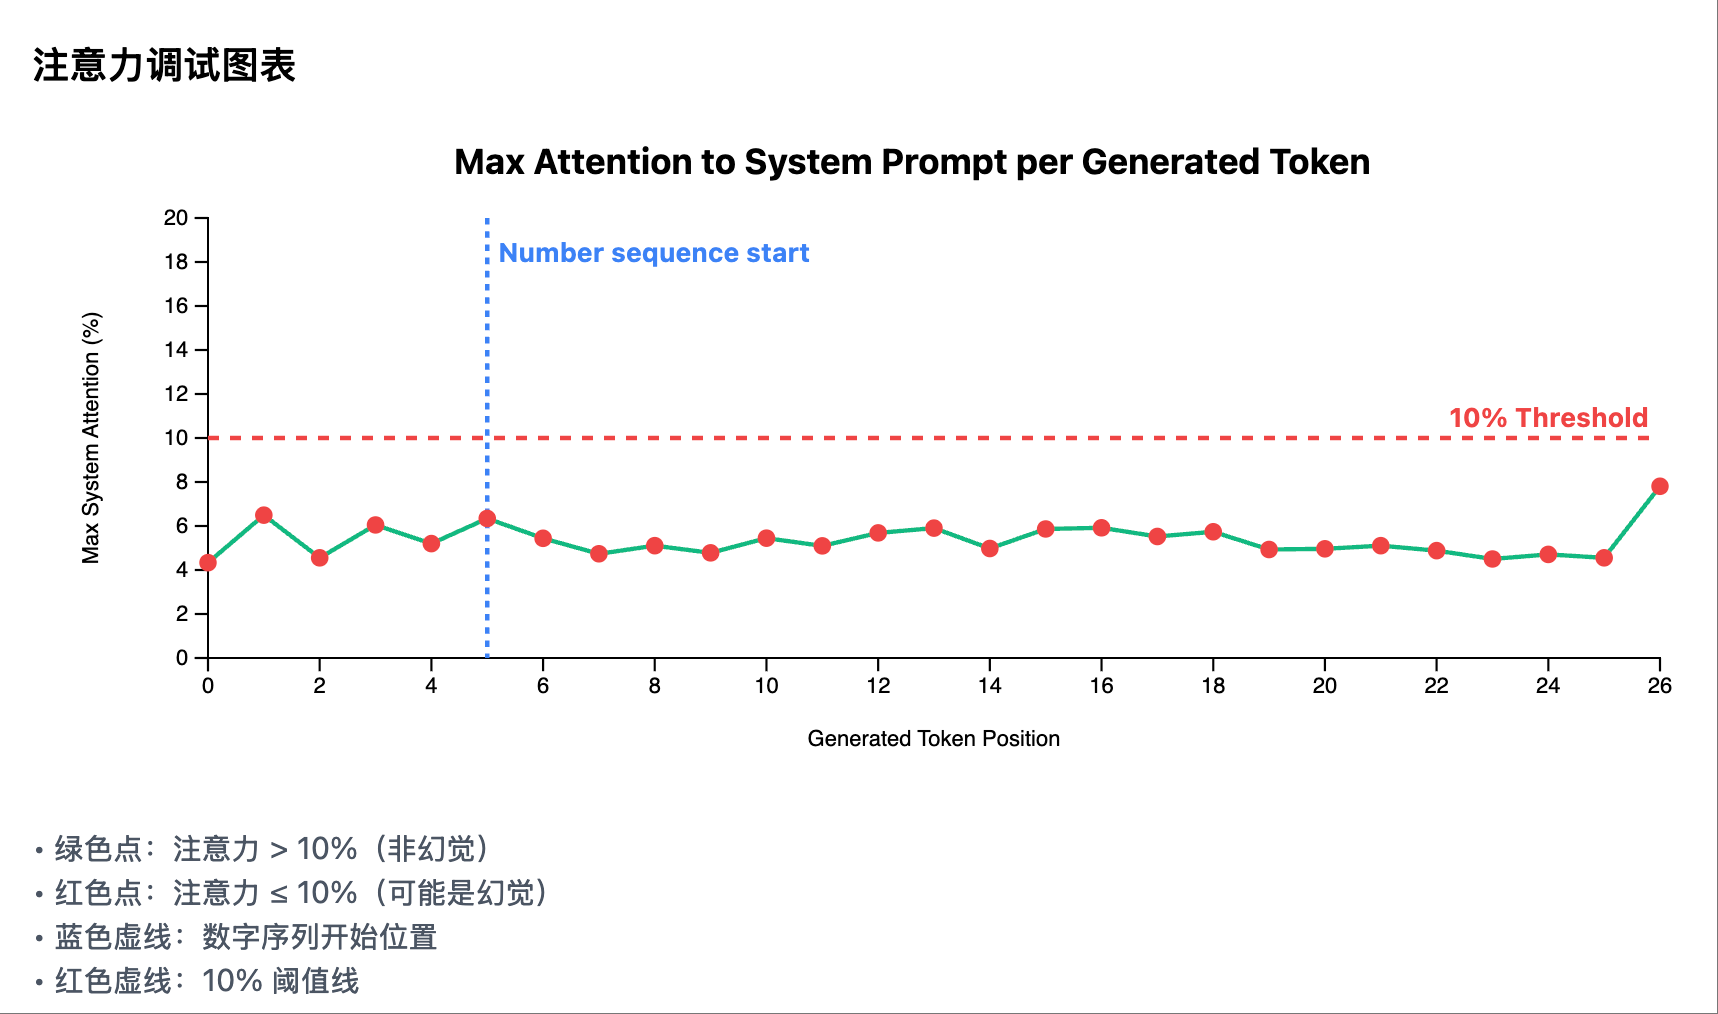 Illusion Scenario 2: Attention Curve for Each Generated Token in System Prompt Area
The Right Approach to Vibe Coding: Be a Teacher, Not a Student
Vibe Coding represents the future of software development, but it requires us to shift our mindset:
- From Coder to Designer: The focus is not on writing code, but on designing solutions.
- From Questioner to Guide: It’s not about asking AI how to do it, but telling AI what to do.
- From Blind Attempts to Data-Driven: First, establish observation tools and let data guide discoveries.
Remember: You are the architect, product manager, and teacher, and AI is your advanced intern. It has strong execution capabilities but needs your guidance and correction. If you are unclear about what you want, AI will only wander in a maze.
❌ Wrong Approach (Student Mindset):
- “How should this illusion detection be done?”
- “Why is the result incorrect? Can you take a look?”
- “I don’t know if this method will work, let’s try it first.”
✅ Right Approach (Teacher Mindset):
- “Implement a heatmap, the requirement is…” (Clear requirement)
- “Your understanding is incorrect, the correct one is…” (Specific correction)
- “Based on observations, the algorithm should be…” (Clear design)
This is the essence of Vibe Coding—not to let AI think for you, but to let AI assist you in implementation.
The entire exploration process, from establishing visualization to coding the entire solution, took only 2 hours. This is the efficiency boost brought by the correct Vibe Coding approach. The time limit for our company’s interview questions for candidates is also 2 hours.